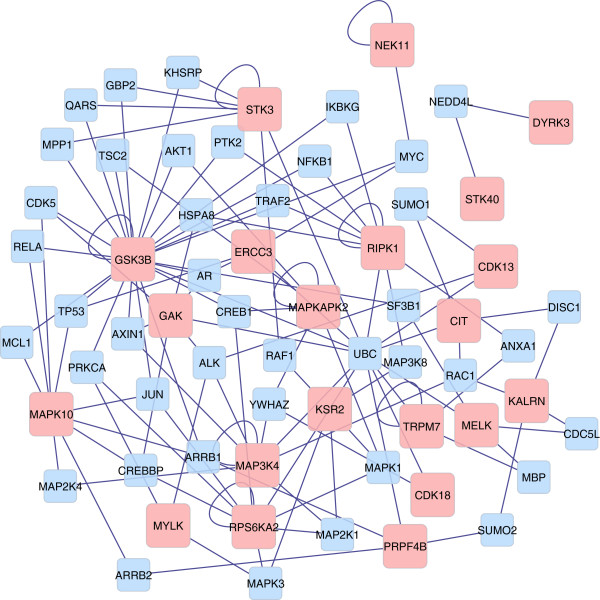
Figure 3.
Network of genes associated with feed efficiency that has protein serine/threonine kinase activity. Interaction between the significant genes from the functional analysis of feed efficiency (P-value < 0.001). Genes significantly associated with feed efficiency (target genes; P-value < 0.01) are represented by pink nodes, whereas those in blue represent intermediate genes. The size of the network nodes from the target genes is a function of the P-values from the association analyses, in which larger nodes indicate more significant P-values. Target genes with self-edges indicate genes with self-regulation activity.

