
Figure 1.
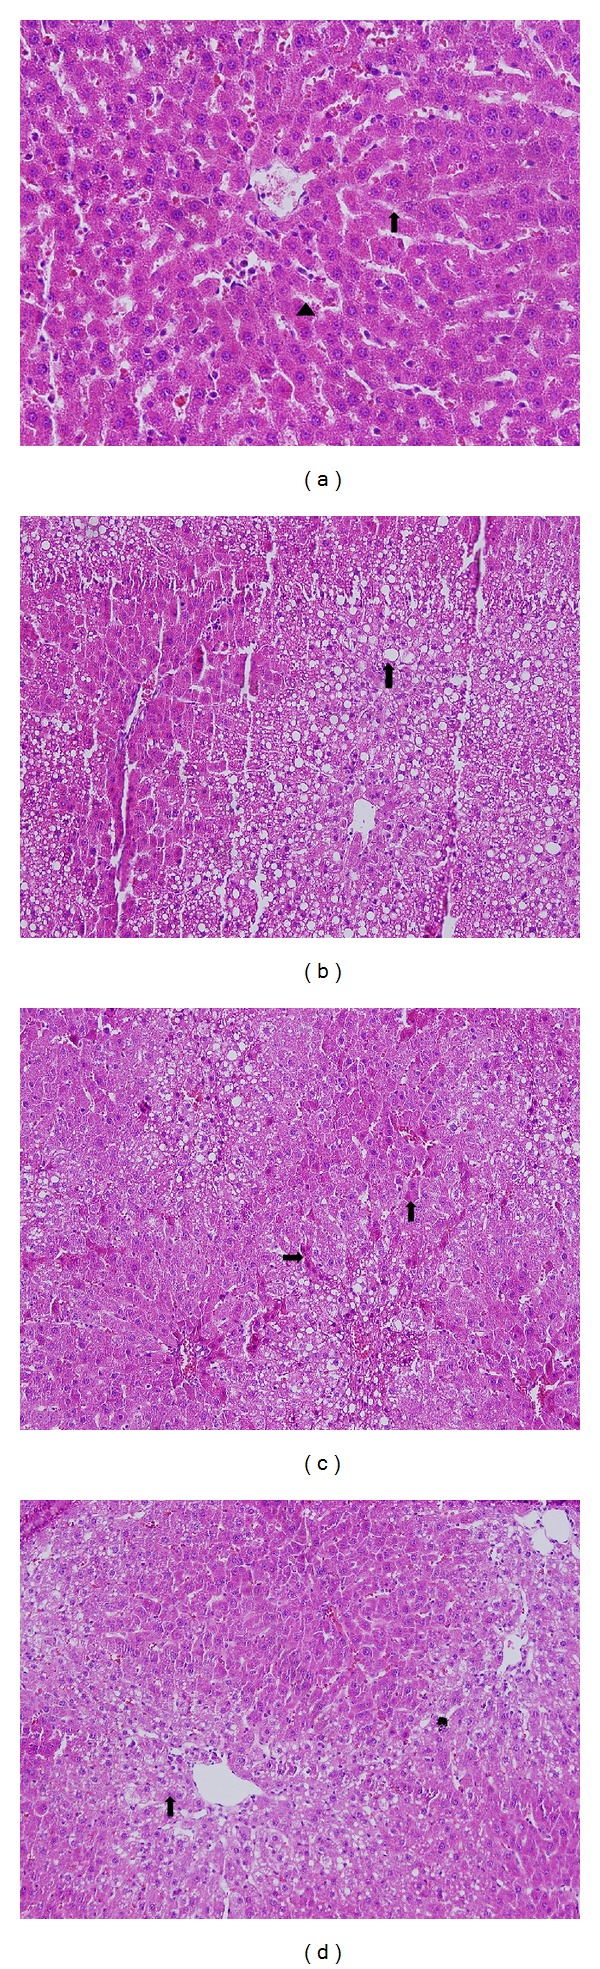
Histopathological analysis of treated and untreated liver sections. (a) Normal hepatocytes (↑) and sinusoids (▲) in the control group, untreated CCI4 (H&E ×100). (b) Destroyed group with CCI4 (G4), increased fatty degeneration (↑). (c) Pollen-treated group (G6) with 200 mg/kg, decreased fatty degeneration and regeneration in hepatocytes (↑). (d) Pollen-treated group (G7) with 400 mg/kg pollen, fatty degeneration markedly decreased (↑).