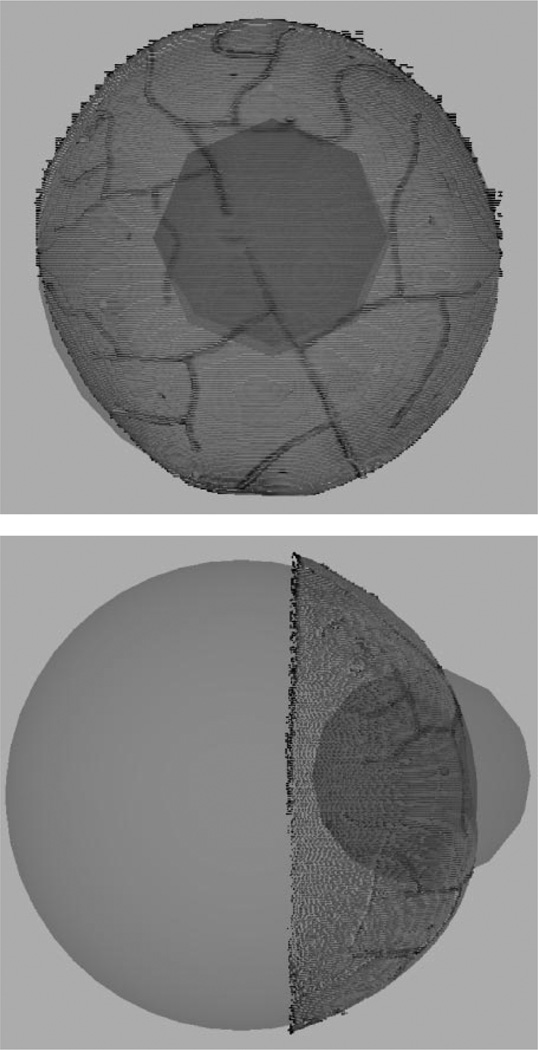
Fig. 6.
Simulated deep tissue sampling. The larger sphere demonstrates the geometric sphere fit of the point cloud. The smaller sphere represents a sampling region with radius of 50 mm, centered about the centroid of the localized fiducials. The volume of overlap demonstrates the deep tissue sampling region.

