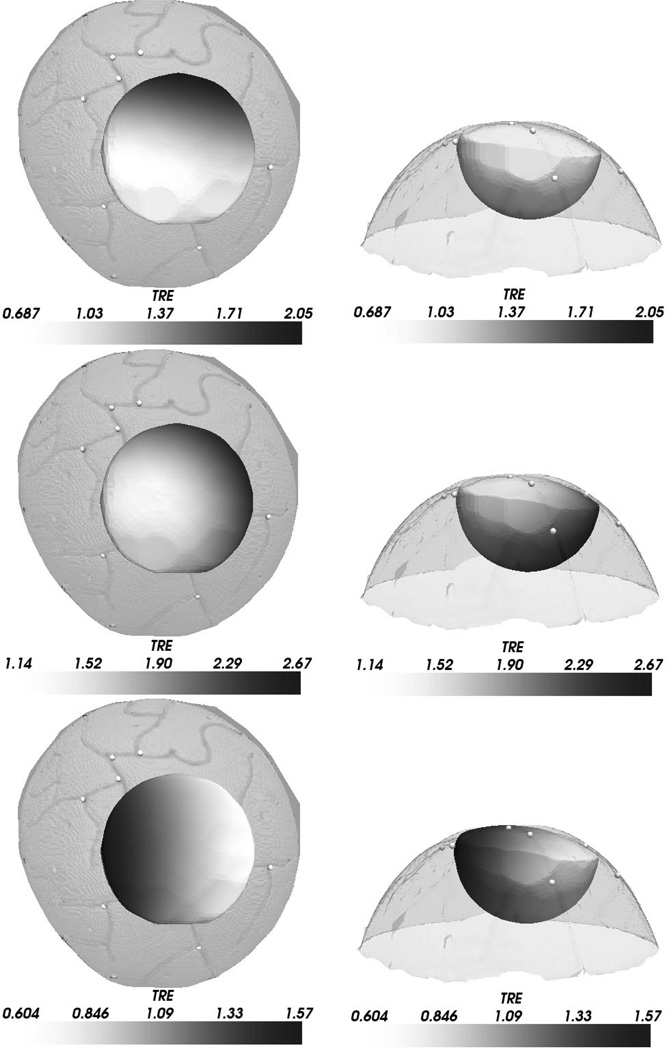
Fig. 9.
Three-dimensional distribution of TRE for deep tissue targets. The left column shows a top-down view of the watermelon surface with the TRE distribution shown for PBR (top), ICP (middle), and SurfaceMI (bottom). The right column shows the respective front views of the TRE distribution. Each deep tissue sample of TRE is grayscale encoded on the hemispheric surface shown. The range of scalar values is shown in the color bar associated with each figure.

