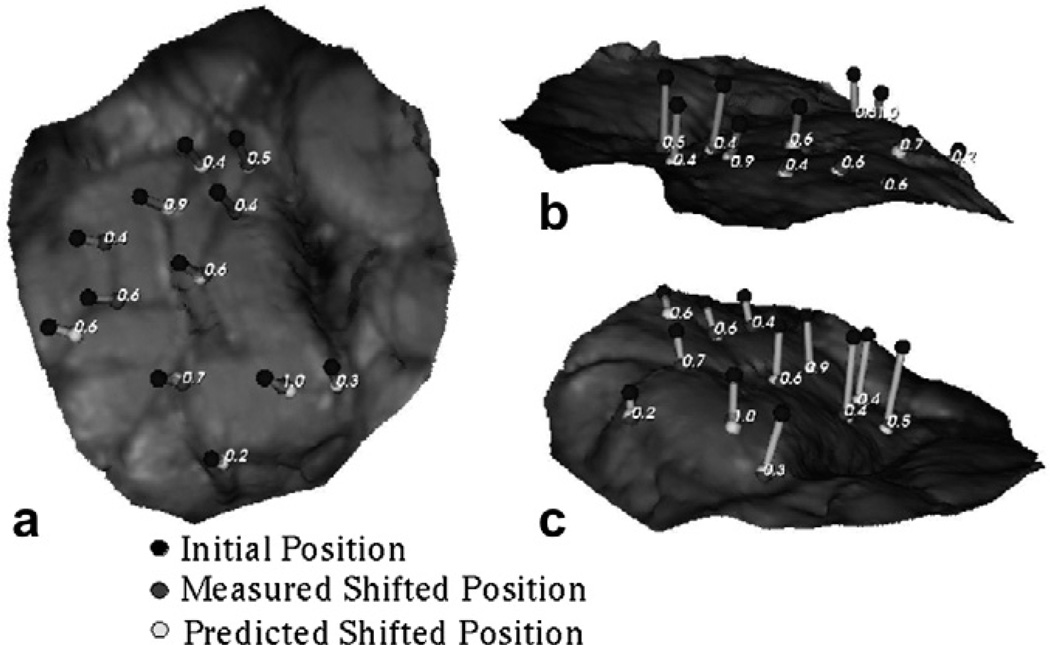
Fig. 10.
Measured and shift vectors predicted using the constrained linear inverse model (shown as line segments) overlaid on the post-resection LRS surface for Patient 1. Shift predicted using Atlas IV (mannitol being the solitary shift causing factor, tumor resected from the tissue volume) has been shown here. The numbers in the figures represent the absolute error between the measured and predicted shift. Each figure, (a), (b) and (c) demonstrates the overlay from a different camera angle to assist with depth perception.

