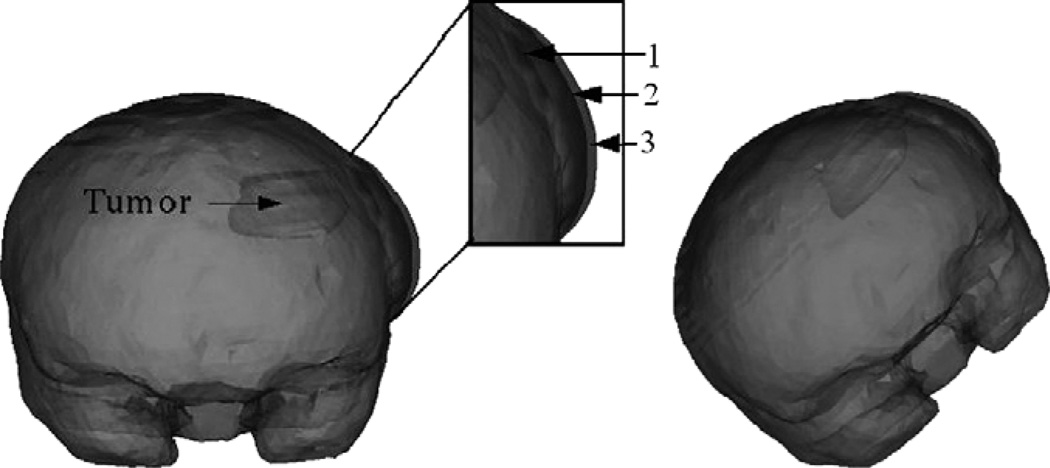
Fig. 7.
Two frontal views of the volume rendered brain with an increase in tissue volume simulated at the craniotomy region, simulated using two different kc values. The craniotomy region is highlighted and zoomed in to show the increase in tissue volume on a finer scale. 1 in the figure refers to the undeformed mesh. 2 refers to the increase in tissue volume simulated using kc1. 3 refers to the increase in tissue volume simulated using kc2. kc1 and kc2 values have been reported in Appendix A.2. Though the falx cerebri was modeled, it has not been shown in the figure.

