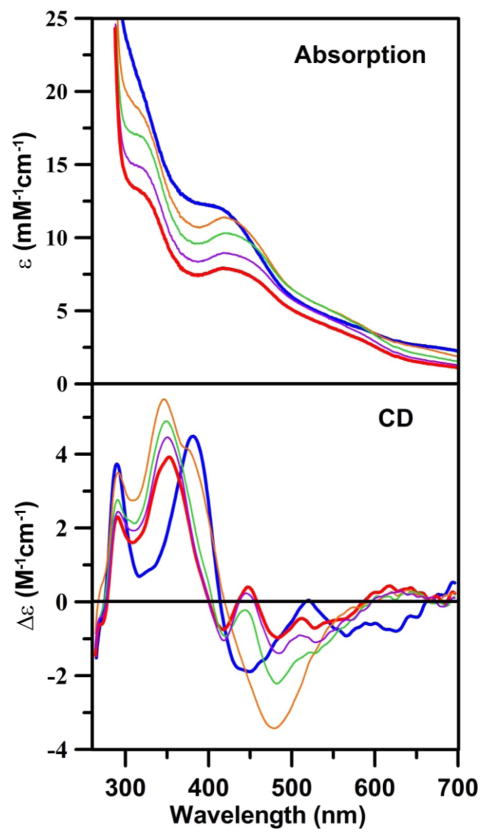
Figure 5.
UV-visible absorption and CD monitored [4Fe-4S] cluster to [2Fe-2S] cluster conversion on AtNfu2 in the presence of EDTA. The zero time point of the reaction corresponds to the as-reconstituted [4Fe-4S] cluster-bound AtNfu2 (thick blue lines). Spectra were recorded 10 min (thin orange line), 30 min (thin green line), 60 min (thin purple line), and 90 min (thick red line) after addition of a 20-fold excess of EDTA (with respect to initial [4Fe-4S]2+ cluster concentration). ε and Δε values were calculated based on the initial concentration of [4Fe-4S] clusters in the sample.

