Figure 7.
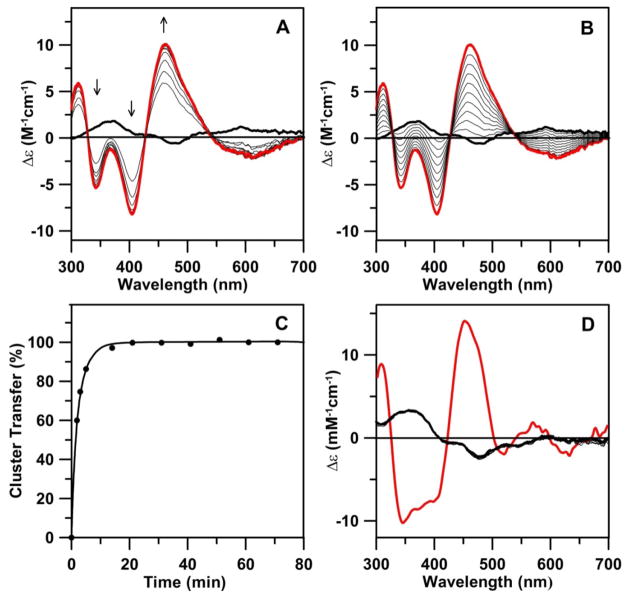
[2Fe-2S] cluster transfer from AtNfu2 to apo At GrxS16 and GrxS14 monitored by CD spectroscopy at room temperature as a function of time. All Δε values are based on the concentrations of [2Fe-2S] clusters on Nfu2. (A) CD spectra of cluster transfer from Nfu2 (39 μM in [2Fe-2S] clusters) to GrxS16 (162 μM in monomer) were recorded at 2.0, 3.5, 5, 14, 21, 31, 41, 51, 61 and 71 min (thin black lines). The thick black line corresponds to zero reaction time, i.e. [2Fe-2S] cluster-bound Nfu2, and the thick red line corresponds to complete [2Fe-2S] cluster transfer to GrxS16. The arrows indicated the direction of change in CD intensity with time at selected wavelengths. (B) Simulated quantitative changes in CD spectra based on complete cluster transfer from [2Fe-2S]-Nfu2 (thick black line) to GrxS16 (thick red line). The thin black lines correspond to 10 to 90% completion of cluster transfer in 10% increments. (C) Kinetic simulation (black line) of cluster transfer from [2Fe-2S]-Nfu2 to GrxS16, based on the initial concentrations of [2Fe-2S] clusters on Nfu and of apo GrxS16 dimer, using a second order rate constant of 7,000 M−1 min−1. Percentage of cluster transfer (●) was assessed by monitoring CD intensity at 461 nm. (D) CD spectra for attempted cluster transfer from Nfu2 (39 μM in [2Fe-2S] clusters) to GrxS14 (150 μM in monomer) recorded at 3, 11, 21, 31, 41 and 51 min (thin lines). The thick black line corresponds to zero reaction time, i.e., [2Fe-2S] cluster-bound Nfu2, and the thick red line corresponds to complete cluster transfer [2Fe-2S] to GrxS14.

