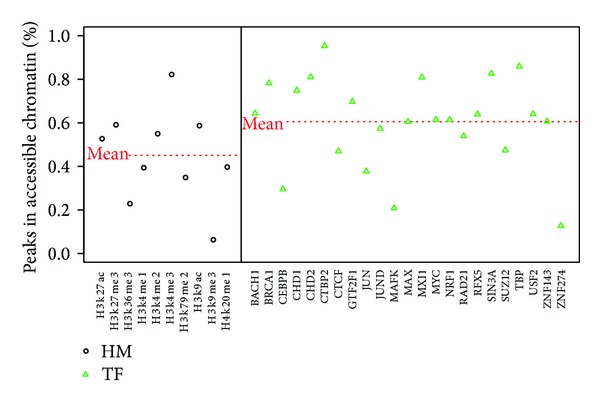
Figure 1.

The percentages of histone modification (HM) features and transcription factor (TF) binding features within accessible chromatin regions. The black circle and green triangle represent HM features and TF binding features, respectively. The two red lines represent the mean percentages for HMs and TFs, respectively.
