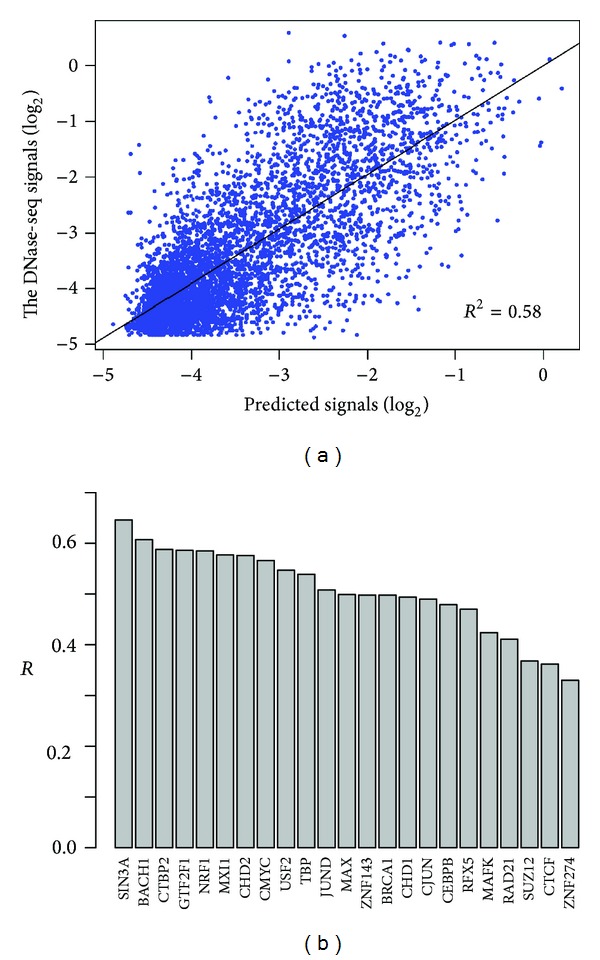
Figure 3.

Prediction accuracy of chromatin accessibility using TF binding features. (a) Scatter plot of predicted versus experimentally measured DNase-seq signals using all TF binding features. The black line represents the linear fit between predicted and measured signals (R 2, coefficient of determination). (b) Prediction powers (R, the square root of coefficient of determination) of the SVR models using only one particular TF binding feature.
