. 2013 Jul 30;21(4):258–263. doi: 10.4062/biomolther.2013.044

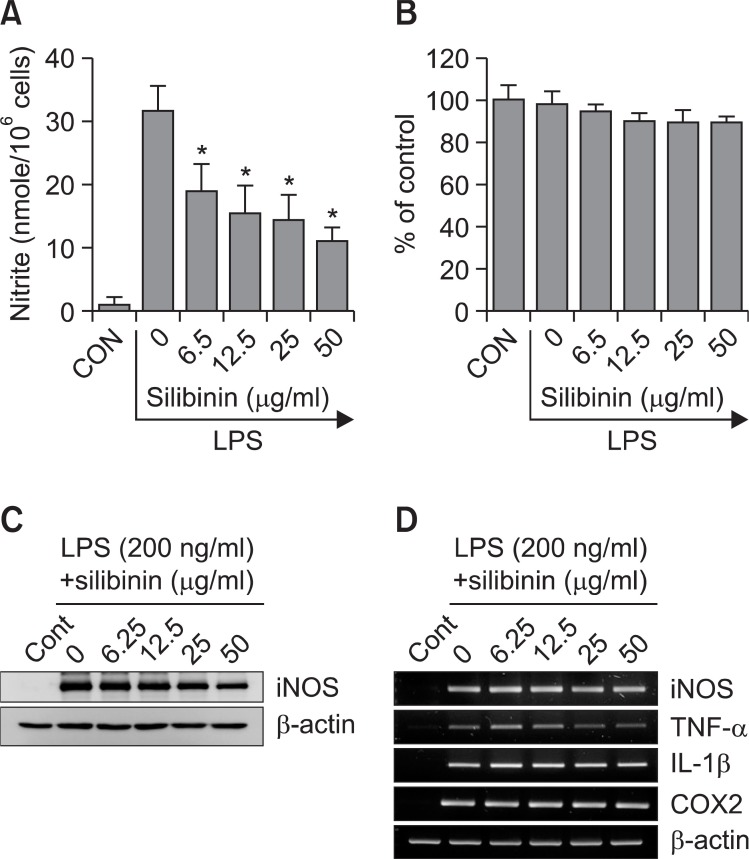
Fig. 2. Inhibition of iNOS expression by silibinin. (A, B) RAW 264.7 cells (5×10⁵ cells/ml) were treated with the indicated concentrations of silibinin in the presence of LPS (200 ng/ml) for 18 h. (A) The supernatants were subsequently isolated and analyzed for nitrite. (B) Cells were subjected to MTT assay. (C, D) RAW 264.7 cells were treated with the indicated concentrations of silibinin in the presence of LPS for 18 h (C) or 8 h (D). (C) Expression of iNOS was analyzed by Western immunoblotting using an antibody specific for iNOS. (D) Total RNA was isolated and analyzed for mRNA expression levels of iNOS, TNF-α, IL-1β, and β-actin. Each column shows the mean ± S.D. of triplicate determinations. An *, indicates a response that is significantly different from the control group as determined by Dunnett's two-tailed t test at p<0.05.

Fig. 2.