
Figure 5.
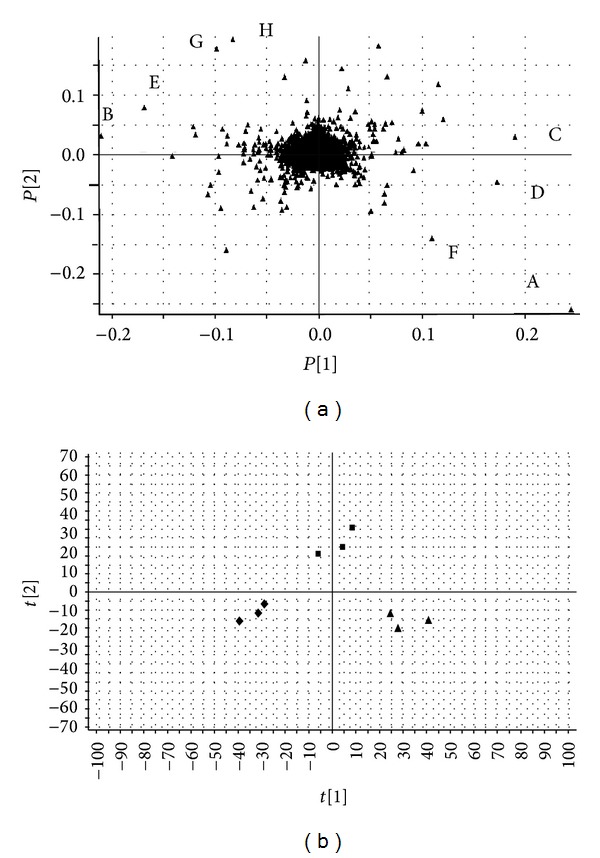
(a) Loading plot in positive ion mode from a PCA model. (A) lysoPC (18 : 0); (B) lysoPC (16 : 0); (C) PG (16 : 0/18 : 0); (D) behenic acid; (E) 8,9-epoxyeicosatrienoic acid; (F) stearic acid; (G) glycine; (H) glutamic acid. (b) Score plot (▲) control group rats, (■) model group rats, and (◆) treatment group rats in positive ion mode from a PLS-DA model.