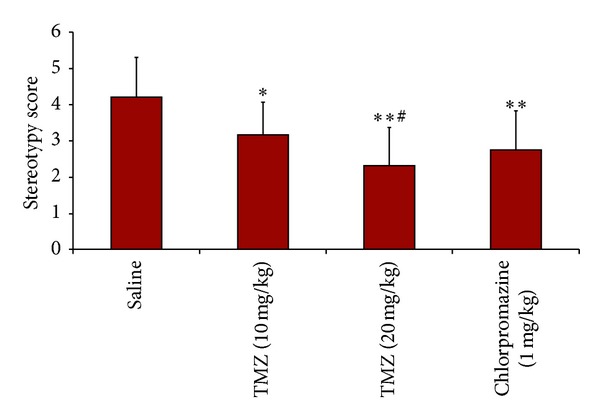
Figure 2.

Apomorphine-induced stereotypy scores. Data are expressed as mean ± SEM. Statistical analysis was performed by one-way analysis of variance (ANOVA) and Bonferroni's post hoc test. *different from saline, P = 0.004, **different from saline, P = 0.000, #different from TMZ (10 mg/kg), P = 0.033.
