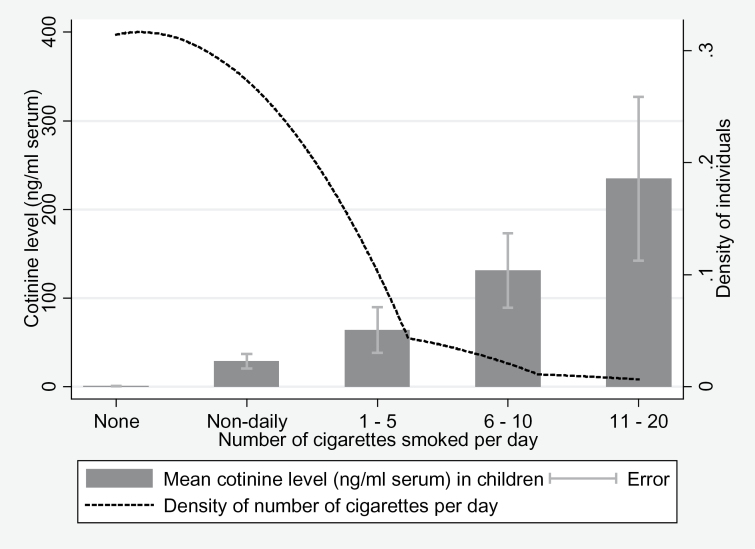
Figure 1.
Association of child cotinine level with child smoking behavior at age 15. The bar chart shows the means of child’s cotinine level (ng/ml serum) by number of cigarettes smoked per day (none, nondaily, 1–5, 6–10, 11–20) at age 15 years. A kernel density plot has been superimposed over this graph to show the density of individuals by the number of cigarettes smoked per day. This graph shows an increasing mean of cotinine level as the number of cigarettes smoked per day increases. The density of the population decreases as the number of cigarettes smoked per day increases.

