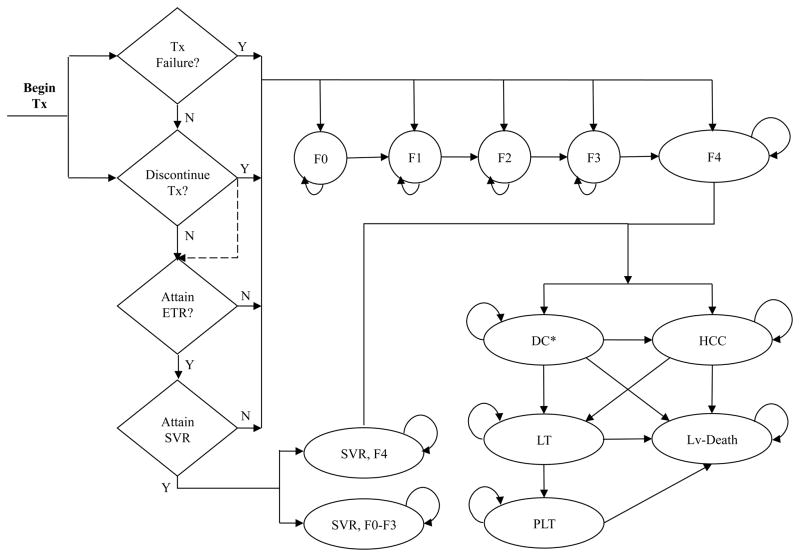
Figure 2.
State-transition diagram for chronic hepatitis C and liver disease model. The model consists of two components: treatment and natural history. If patients discontinue treatment, or fail to achieve an end-of-treatment response (ETR) or a sustained virologic response (SVR), they enter the natural history component of the model, which consists of 14 health states. These include fibrosis states (F0–F4); decompensated cirrhosis (first year [DC1] and subsequent years [DC+]); hepatocellular carcinoma (HCC); liver transplant (first year [LT] and subsequent years [PLT]; liver-related death (Lv-Death); death from all other causes (not shown here); and SVR status states stratified by fibrosis stage (“SVR, F0–F3” and “SVR, F4”).
Y= Yes; N=No.
*For clarity, two decompensated states--DC1 and DC+ are shown as one state, i.e. DC.

