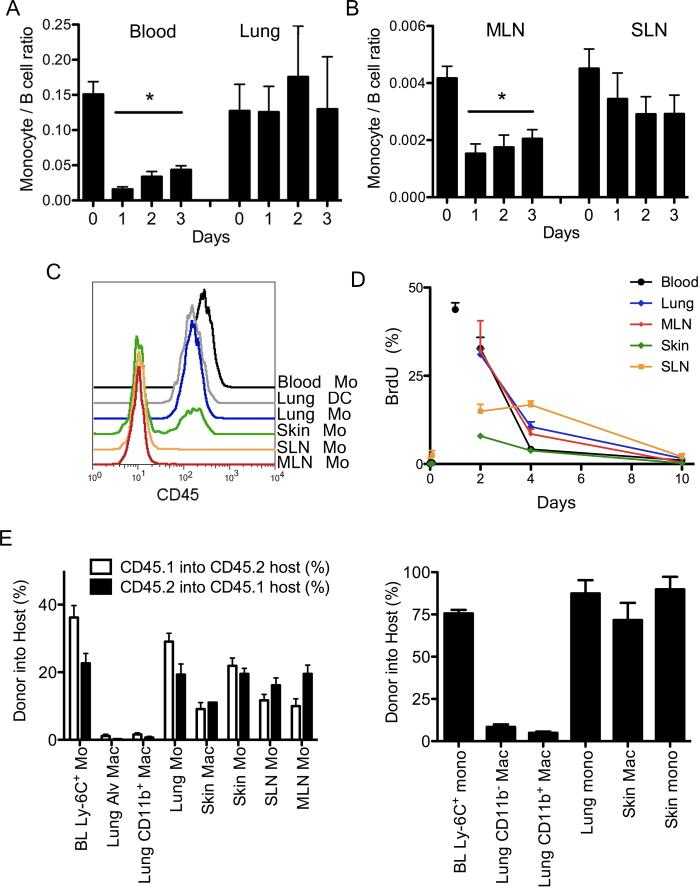
Figure 4. Turnover of tissue monocytes.
Frequency of tissue monocytes, identified in tissues as in Fig. 1A, was analyzed after liposomal clodronate injection i. v. and normalized to B cells in blood and lung (A) and LNs (B). Data are representative of four experiments,2-4 mice per group. C) Overlay of lung DCs and monocytes gated from tissues after anti-CD45 was given i.v. 2 min. before euthanasia. D) BrdU pulse-chase analysis of tissue monocytes, n = 5. E) Plots depict chimerism between WT congenic parabionts at two weeks (left) and WT chimerism in Ccr2−/− hosts parabiosed with a WT partner for 1 year (right). Each bar includes 2-8 parabionts and depicts mean ± SEM. Mo,monocyte; Mac, macrophage. Fig. S4 accompanies this figure.

