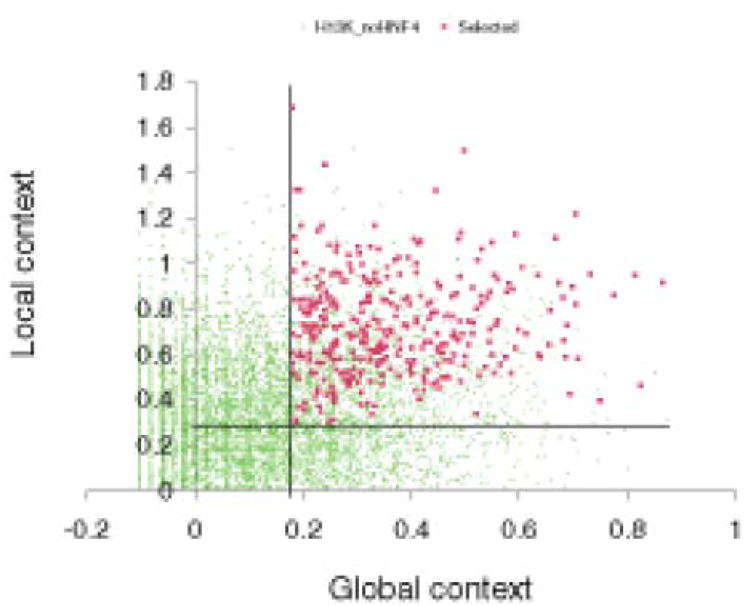
Fig. 2. Computational Analysis of HNF4α binding sequences.

Plot of the distribution of global and local contexts in the 375 sequences (red squares) selected from the ‘positive’ set of ChIP-chip results reported by Odom et al. versus all 10,852 sequences from the ‘negative’ (not binding; set (green dots) reported for the same experiment. The selected sequences are characterized by the highest global and local context scores whereas the majority of the ‘negative’ sequences are characterized by low values for these two scores. The vertical and horizontal lines show two thresholds chosen for the global context score (0.28) and the local context score (0.18). Figure is adopted from article Kel et al. Genome Biology 2008 9: R36 doi:10.1186/gb-2008-9-2-r36. Genome Biology is an open access journal and grants unrestricted permission to re-distribution and re-publication of the work.
