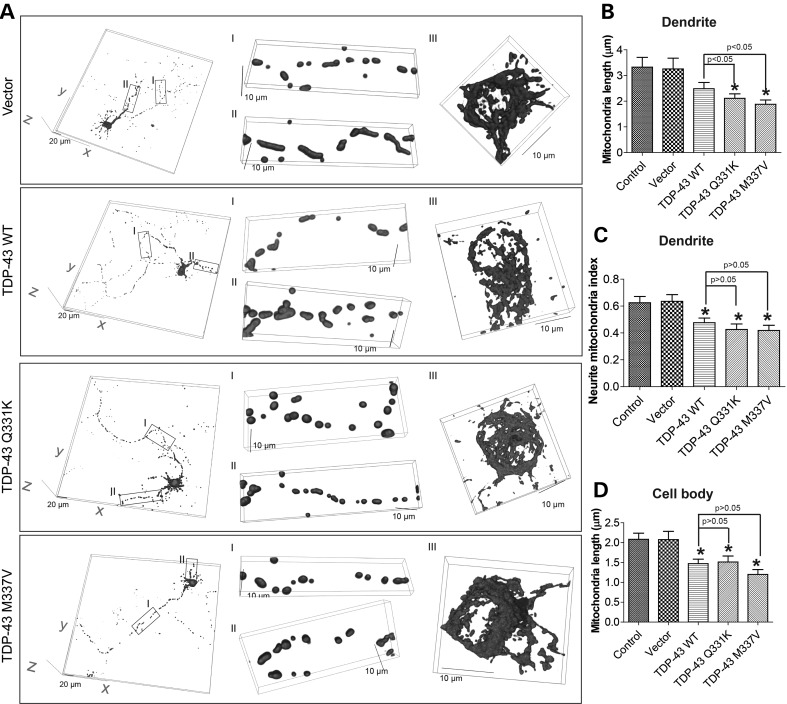
Figure 1.
Effect of TDP-43 overexpression on mitochondrial morphology. (A) Representative 3-dimensional (3D) pictures of mitochondria in primary rat motor neurons at day in vitro 9 (DIV9) co-transfected with constructs encoding flag tagged TDP-43 and mito-DsRed2 at DIV7. Vector: neurons expressing empty vector; TDP-43 WT: neurons expressing wild-type TDP-43; TDP-43 Q331K: neurons expressing mutant TDP-43 Q331K; TDP-43 M337V: neurons expressing mutant TDP-43 M337V. Left panels: large field of view of mitochondria in motor neurons; Middle panels: enlargement showing mitochondria in axons (enlargement I) and dendrites (enlargement II). Right panels: enlargement showing mitochondria in cell bodies (enlargement III). (B and C) Quantification of mitochondria length (B) and density (i.e. neurite mitochondria index = total mitochondrial length/neurite length) (C) in dendrites. (D) Quantification of mitochondria length in cell bodies. Control: control neurons expressing mito-DsRed2 only. At least 20 neurons were analyzed in each experiment and experiments were repeated three times. Data are means ± s.e.m. Statistics: one-way analysis of variance (ANOVA) followed by Tukey's multiple comparison test. *P < 0.05, compared with control neuron.

