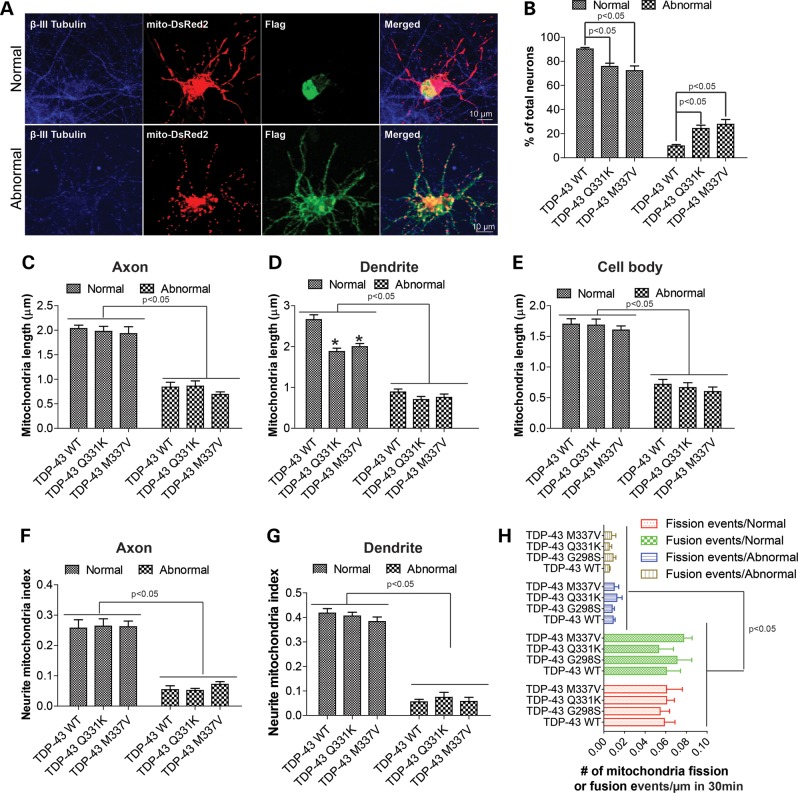
Figure 7.
Mitochondrial morphological dynamics in motor neurons with abnormal cytoplasmic exogenous TDP-43. Primary rat motor neurons were co-transfected with flag/BFP tagged TDP-43 and mito-DsRed2/mito-AcGFP at DIV7, fixed at DIV9 and stained with antibodies against pan neuronal marker β-III tubulin and flag. (A) Representative confocal images of mitochondria in motor neurons expressing flag tagged WT TDP-43 and showing either normal nuclear and abnormal cytoplasmic localization of exogenous TDP-43. Blue: β-III tubulin; Green: flag; Red: mito-DsRed2. (B) Quantification of the percentage of neurons showing normal or abnormal exogenous TDP-43. (C–E) Quantification of mitochondrial length in axons (C), dendrites (D) and cell bodies (E). (F and G) Quantification of mitochondrial density (neurite mitochondrial index) in axons (F) and dendrites (G). (H) Quantification of the number of fission and fusion event in axons of neurons overexpressing BFP-tagged TDP43 and mito-DsRed2 at DIV9. Images were captured every 10 s for a total of 161 images (30 min). At least 30 neurons were analyzed in each experiment and experiments were repeated three times. Data are means ± s.e.m. Statistics: one-way analysis of variance (ANOVA) followed by Tukey's multiple comparison test. *P < 0.05, compared with neuron expressing WT TDP-43.

