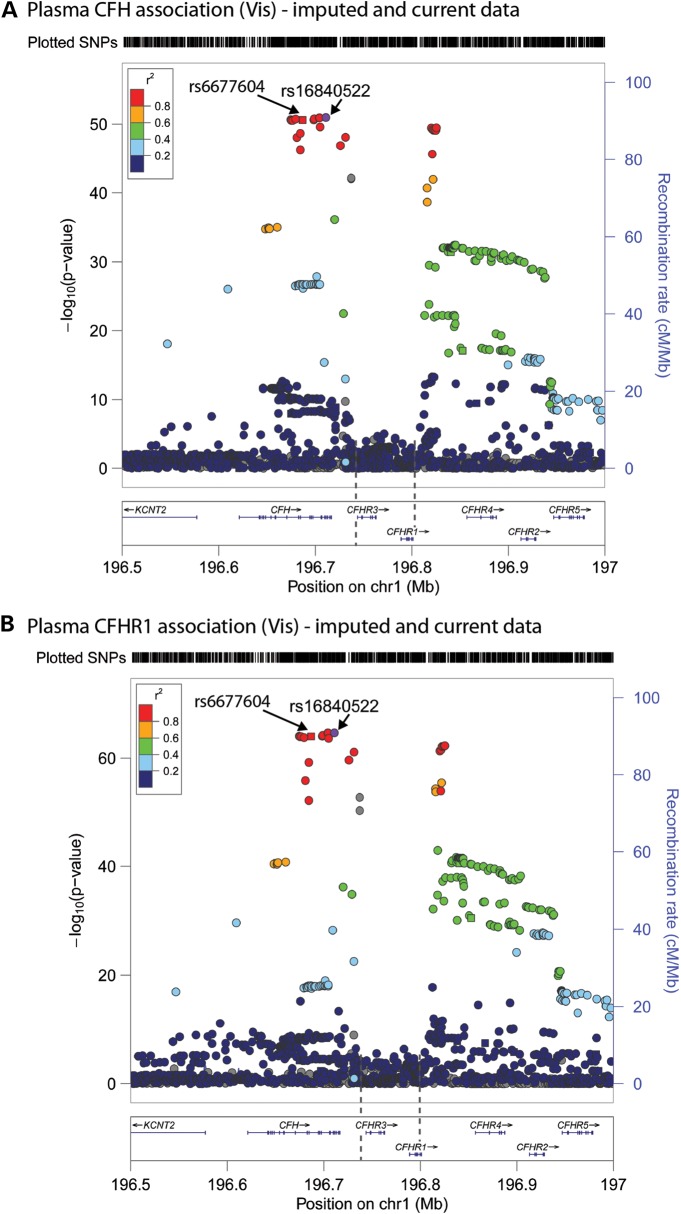
Figure 3.
GWAS of plasma CFH and CFHR1 concentrations in the Croatian cohort (n = 1004), including both genotyped and imputed SNPs. Manhattan plots showing GWAS results for plasma CFH (A) and CFHR1 (B) using 1000 Genomes Project imputed data, in which the circles show the statistical strength of the association (−log10 P-value), coloured according to the pair-wise correlations (r2) between surrounding markers and the most strongly associated variant (imputed SNP rs16840522). Variants that were poorly imputed (imputation Rsq ≤ 0.4) were filtered out and the results are shown for a 500 kb window encompassing the CFH and CFHR1-5 genes. The right-hand y-axis and purple line show recombination rates across the region, whereas the x-axis shows the position on chromosome 1 and genomic annotations showing the boundaries of the CFHR3/CFHR1 (CNP147) deletion (dotted vertical lines), direction of transcription (arrows) and genomic location of exons (to scale, vertical lines within the genes).

