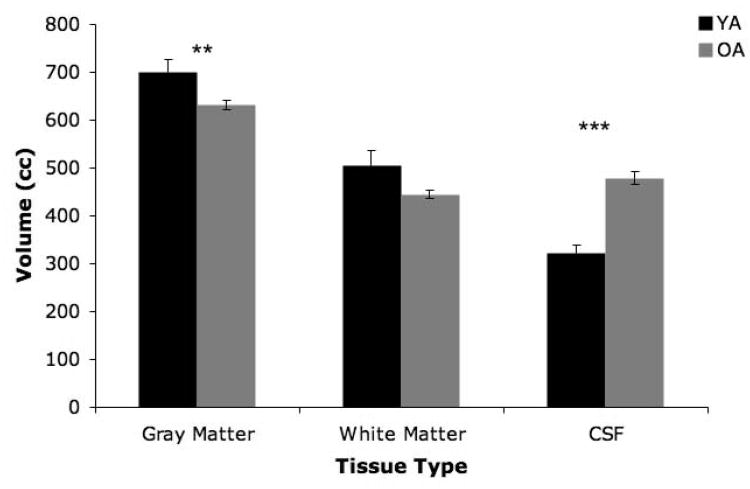
Figure 2.
Age differences in cerebral tissue types (YA: black bars; OA: gray bars). There was no significant main effect of age, though there was a significant age by tissue type interaction. Follow-up t-tests indicated significant age differences in gray matter and CSF volume (**p<.01; ***p<.001). Error bars represent the standard error of the mean.

