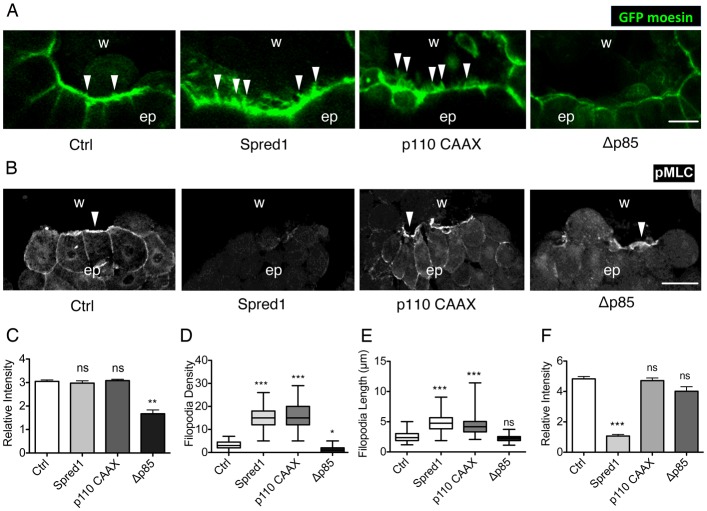
Fig. 5.
ERK regulates myosin-2 phosphorylation and PI3K promotes actin accumulation and filopodia formation at the wound edge. (A) Confocal images of actin cable and filopodia at the wound edge in GFP-moesin-injected embryos in combination with control, spred1, p110caax and Δp85 mRNA injections, 10 minutes post wounding. Arrowheads indicate filopodia. Scale bar: 20 µm. (B) Immunofluorescent staining of pMLC on transected wounds in control uninjected embryos and embryos injected with spred1, p110caax and Δp85. Embryos were fixed 10 minutes post wounding. w, wound area; ep, epithelium. Arrowheads indicate pMLC at the wound edge. Scale bar: 50 µm. (C) Quantification of relative F-actin fluorescence intensity at the wound edge. n = 20 cells from 10 embryos from three batches were measured. (D) Quantification of filopodia number per 100 µm in wounds. nctrl = 65, nΔp85 = 44, np110 = 75, nspred1 = 51 (×100 µm of wound edge) of at least 20 embryos from three batches were analysed. Data are plotted as box and whisker plots. (E) Quantification of filopodial length in wounds. nctrl = 63, nΔp85 = 85, np110 = 122, nspred1 = 105 (filopodia) on at least 20 embryos from three batches were analysed. Data are plotted as box and whisker plots. (F) Quantification of relative pMLC fluorescence intensity at the wound edge. n = 20 wound edge cells from at least three batches of embryos were analysed. All results are shown as means ± s.e.m. and Kruskal–Wallis one-way ANOVA test was used to compare all groups to control. *P<0.05, **P<0.01, ***P<0.001; ns, not significant.

