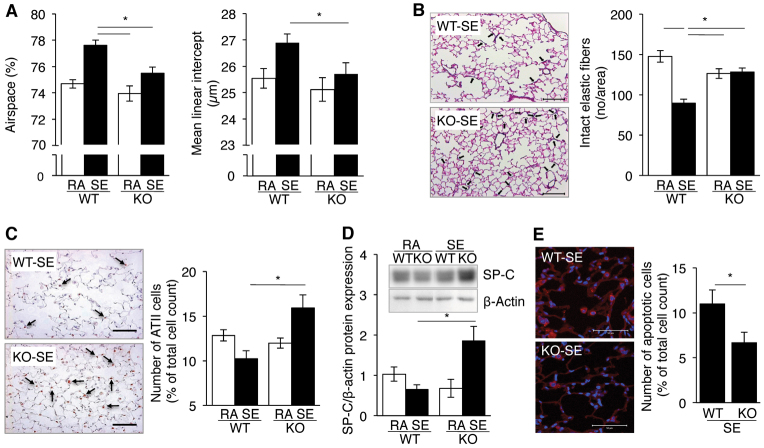
Fig. 1.
Protection of Sesn2 KO mice from cigarette-smoke-induced emphysema. (A) Total airspace (left) and mean linear intercept (right) of lungs from wild type (WT) and Sesn2 KO (KO) mice exposed to room air (RA) or cigarette smoke (smoke exposed; SE). Results are represented as means ± s.e.m. of n=7–14 individual mice per group. (B) Elastic fibres in lungs of WT and KO mice exposed to cigarette smoke. Left panel: representative histological sections stained for elastic fibres. Intact elastic fibres are marked by black arrows. Scale bars: 100 μm. Right panel: quantification of intact elastic fibres by light microscopy at 40× magnification. Elastic fibres were counted within an area of 0.07598346 mm2 using 175–370 images per section (see Materials and Methods for details). Results are represented as means ± s.e.m. of lungs from n=5 individual mice per group. (C) Reduction of alveolar type II (AVII) cells in mice exposed to cigarette smoke. Left panel: histological sections stained with an alveolar epithelial type II (ATII)-cell-specific TTF1 antibody. TTF1-positive cells (arrows) have brown stained nuclei. Scale bars: 100 μm. Right panel: frequency of TTF1-positive cells in WT and Sesn2 KO mice exposed to room air (RA) or cigarette smoke (SE). The fraction of TTF1-positive cells was derived from a mean of 992±171 cells from three randomly chosen sections of each lung. Cells were counted at 20× magnification. Results are represented as means ± s.e.m. of lungs of n=4 individual mice per group. (D) Surfactant protein C (SP-C) expression by ATII cells in WT and KO mice exposed to room air (RA) or cigarette smoke (SE). Expression levels were estimated from western blots by densitometry (inlay: representative western blot). Results are represented as means ± s.e.m. of n=4 individual mice per group. (E) Frequency of apoptotic cells in lungs of WT and KO mice exposed to cigarette smoke. Left panel: confocal immunofluorescence microscopy of lung sections stained with anti-cleaved caspase 3 (CC3-Cy3) antibody. Apoptotic cells are red (Cy3) and nuclei blue (DAPI). Scale bars: 50 μm. Right panel: frequency of apoptotic cells obtained by counting 400±50 cells from six randomly chosen fields per lung. Results are represented as means ± s.e.m. of n=3 individual mice per group. *P<0.05.

