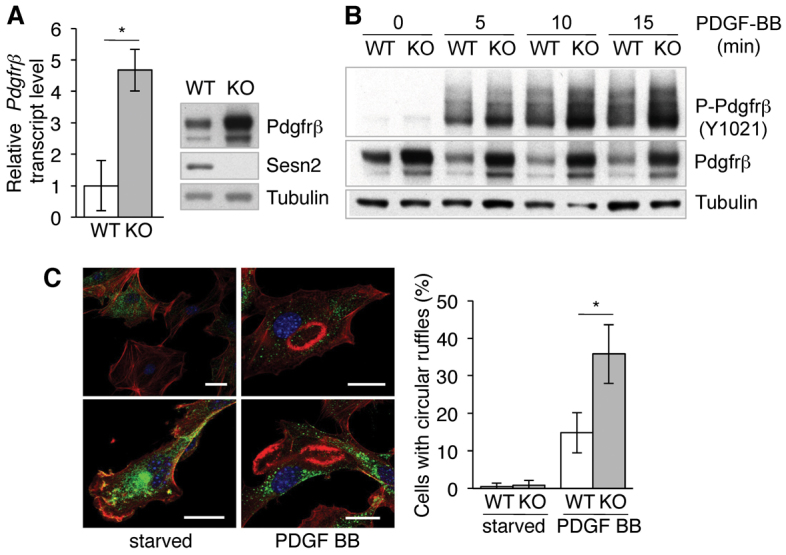
Fig. 2.

Induction of Pdgfrβ expression in Sesn2 KO-MLFs. (A) Left panel: Pdgfrβ mRNA levels in WT and Sesn2 KO (KO) MLFs quantified by qRT-PCR. Results are represented as means ± s.e.m. of n=4 independent experiments. Right panel: representative western blot. (B) Phosphorylated and total PDGFRβ protein levels in MLFs exposed to PDGF-BB. (C) Circular dorsal ruffle formation in MLFs exposed to PDGF-BB. Left panel: confocal images of circular dorsal ruffles. Ruffles, red (phalloidin); PDGFRβ, green (anti-PDGFRβ antibody); nuclei, blue (DAPI). Note the elevated levels of PDGFRβ in the KOMLFs. Scale bars: 20 μm. Right panel: quantitative assessment of circular dorsal ruffle formation. Differential counts were performed on a minimum of 100 cells per experiment. Results are represented as means ± s.e.m. of n=3 independent experiments. *P<0.05.
