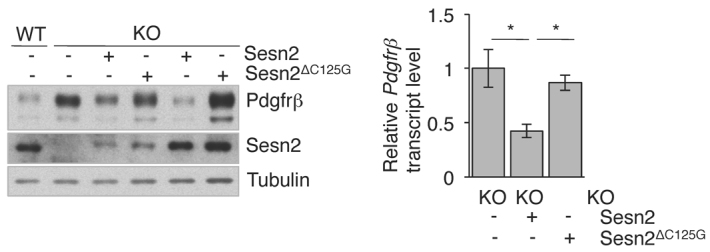
Fig. 3.

Repression of Pdgfrβ expression by SESN2. Sesn2 KO-MLFs were transduced with lentiviral Sesn2 cDNAs. Pdgfrβ expression was assayed in cell pools expressing comparable amounts of SESN2 and SESN2ΔC125G. Left panel: western blot showing PDGFRβ and lentiviral SESN2 expression in transduced KO-MLF cell pools. Right panel: Pdgfrβ mRNA levels quantified by qRT-PCR. Results are represented as means ± s.e.m. of n=3 separate experiments. *P<0.05.
