Fig. 2.

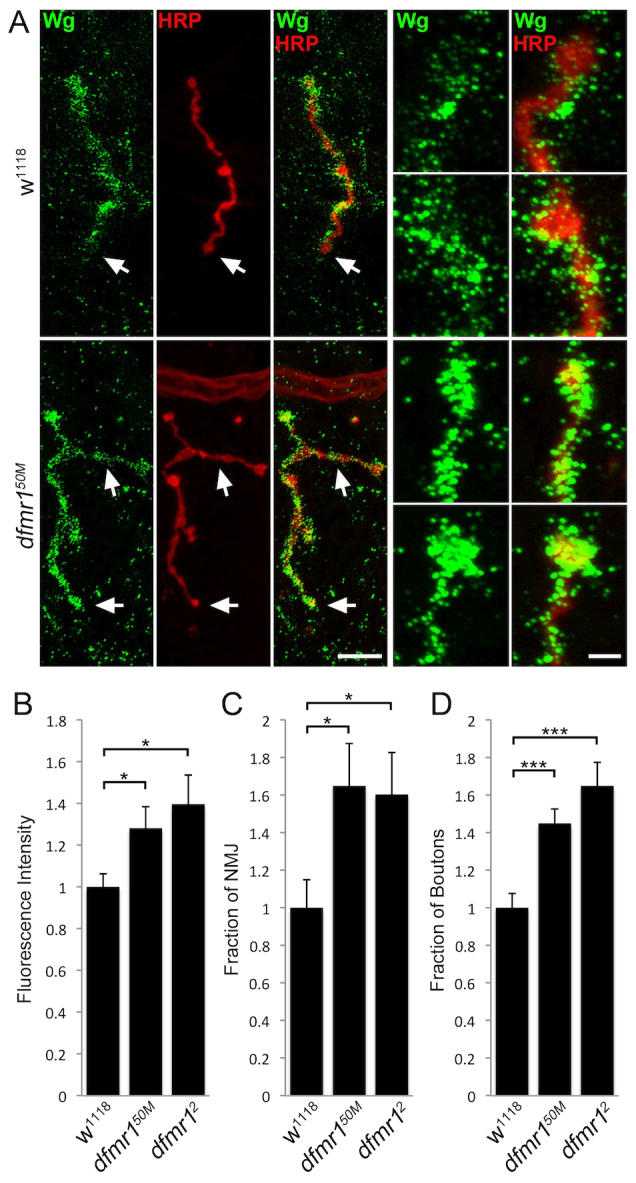
Increased Wg levels and spatial distribution at dfmr1 null NMJs. (A) Representative NMJ images co-labeled with neuronal marker (HRP, red) and anti-Wingless (Wg, green) in control (w1118) and dfmr1 null (dfmr150M) wandering third instar muscle 4. Right panels show synaptic boutons at higher magnifications. Scale bars: 15 μm and 3 μm, respectively. Arrows indicate boutons that have been magnified. (B) Quantification of Wg intensity in dfmr1 nulls normalized to w1118 controls. (C) Analysis of Wg spatial distribution measured as a fraction of the total HRP-labeled NMJ area. (D) Fraction of total HRP-labeled NMJ boutons expressing Wg. Samples sizes are ≥26 animals and ≥52 NMJs for each genotype. Significance is shown as *P<0.05 and ***P<0.001.
