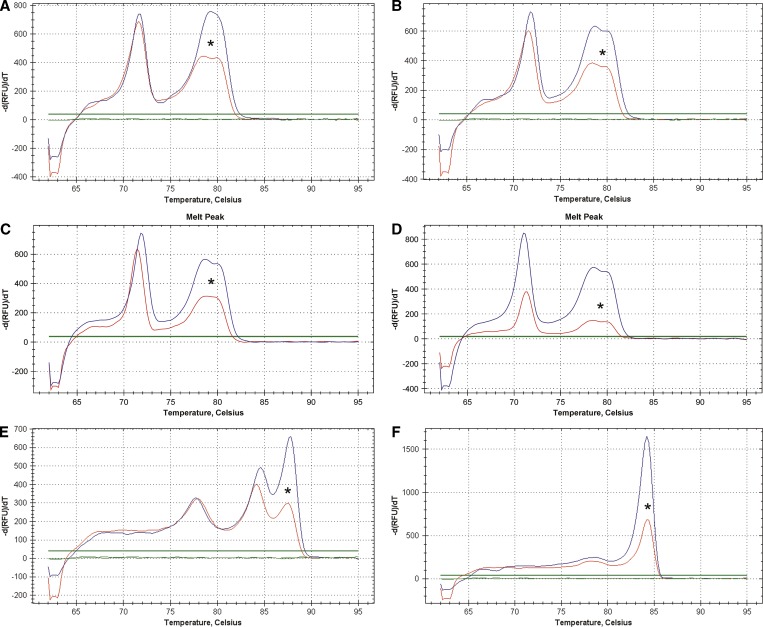
Figure 2.
Representative melt curve graphs for (A) C. hominis, (B) C. parvum, (C) C. canis, (D) C. meleagridis, (E) C. cayetanensis, and (F) C. belli. Melt curve graphs from plasmid DNA controls are unmarked, and those graphs from field isolates identified in this study are marked with an asterisk. Temperature (°C) is displayed on the x axis, and −d(RFU)/dT is displayed on the y axis. Crown Copyright c 2012. Published by AJTMH. All rights reserved.

