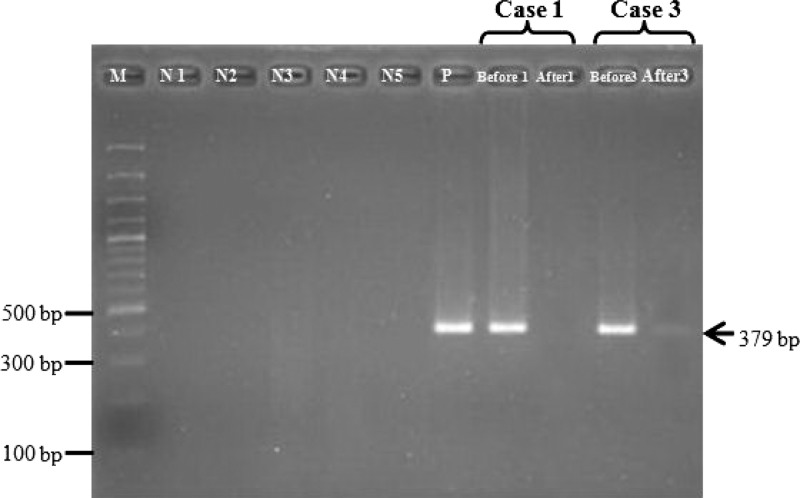
Figure 3.
Changes in L. siamensis DNA in saliva after treatment. Lane M, molecular mass marker (100 basepairs [bp])); lane N1, negative control (no-DNA template: double-distilled water), lanes N2–N5: negative control (DNA template from non-infected saliva, urine, blood, and buffy coat, respectively); lane P, positive control; lane Before1, 3: pre-treatment of case 1 and case 3; lane After 1, 3: post-treatment of case 1 and case 3, respectively.

