
Figure 2.
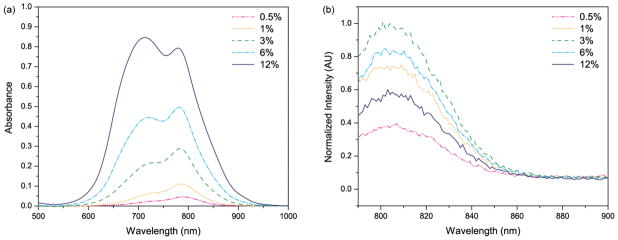
(a) Absorption spectra and (b) normalized fluorescence emission spectra of HSA–PAA NPs, using 780 nm excitation. The absorption and fluorescence measurements were taken with 0.1 mg/mL of 0.5–12% (w/w) ICG loaded HSA–PAA NPs in PBS (pH 7.4) buffer, showing spectral changes with different ICG loading.