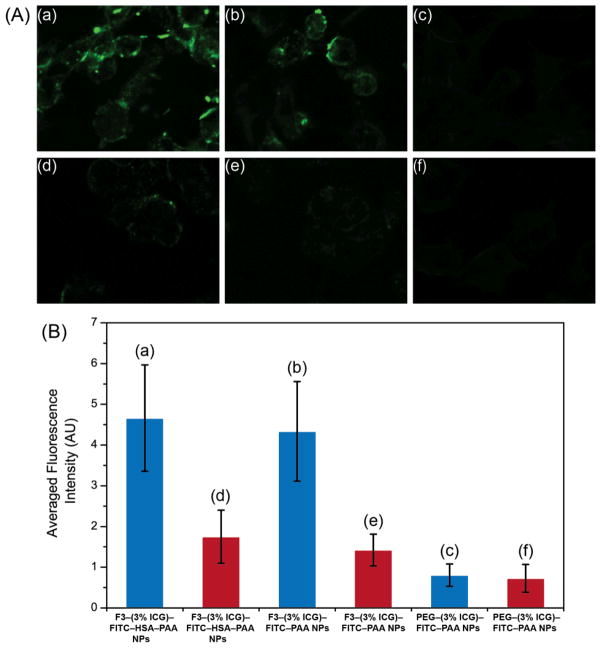
Figure 6.
Confocal images of F3 targeted selective delivery of ICG: A-a) F3–(3% ICG)–FITC–HSA–PAA NPs in 9L cells; A–b) F3–(3% ICG)–FITC–PAA NPs in 9L cells; A–c) PEG–(3% ICG)–FITC–PAA NPs in 9L cells; A–d) F3– (3% ICG)–FITC–HSA–PAA NPs in MCF-7 cells; A–e) F3–(3% ICG)–FITC–PAA NPs in MCF-7 cells; A–f) PEG–(3% ICG)–FITC–PAA NPs in MCF-7 cells; B) Relative cell specificity of F3 and ICG containing NPs, based on averaged fluorescence intensity of the FITC fluorescence confocal image (blue bar is for 9L and red bar is for MCF-7 cells). For quantification, the averaged background was subtracted from the intensity of the cell images.

