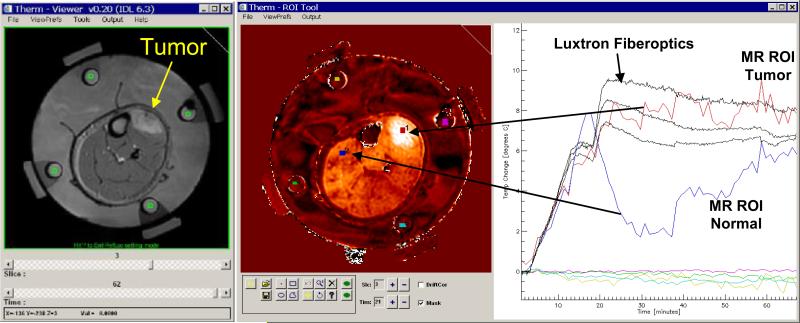
Fig. 6.
Realtime display during MR monitoring of heat treatment. Image at left is anatomical image of leg in MAPA applicator. Four green ROI's were drawn in the middle of the four cylindrical silicone oil reference chambers on the inside of MAPA applicator surrounded by coupling water in each of four MR slices, for use in correcting for magnetic field drifts of the GE 1.5T excite system gradient amplifiers. The central image shows a typical differential temperature image display at about 20 min into heat treatment, after the phase of the four 140 MHz twin dipole heating antennas had been adjusted to move the heat focus into the center of tumor at upper right of leg. The PRFS calculated temperature rise is displayed on the same plot as the invasive Luxtron 3100 fiberoptic sensors at right. The dramatic refocusing of power deposition at 18 min into the heat treatment is seen to shift heating away from normal tissues (such as the blue region of interest in upper left of image) and into the tumor at upper right (red ROI and temperature curve).

