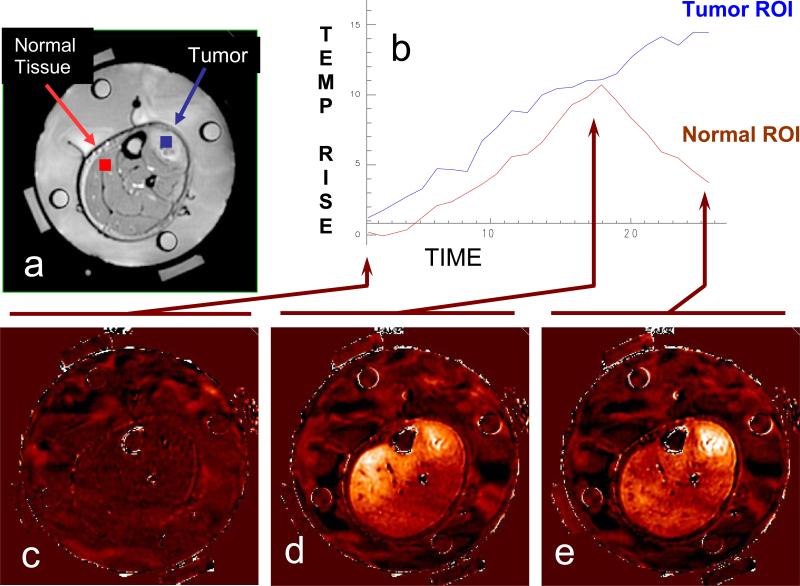
Figure 7.
Dosimetry of a clinical hyperthermia treatment of advanced fibrous histiocytoma (soft-tissue sarcoma) in the lower leg. Tumor is clearly visible in the upper right of leg adjacent to the tibia. a) Anatomic MRI of a patient's lower leg inside MAPA applicator with 4 dipole antenna pairs and 4 silicon oil reference tubes. b) Temperature data as a function of time. c) Baseline temperature change map after 4 minutes of imaging without application of heat, temperatures in the leg are stable at about 36°C; d) Temperature rise image at approximately 18 minutes into treatment - heating of tumor is visible but is less than heating of normal tissue on the upper left side of leg; e) 25 minutes into treatment, after adjusting the antenna phases to focus heat primarily in the tumor region at upper right of leg.

