
Figure 4.
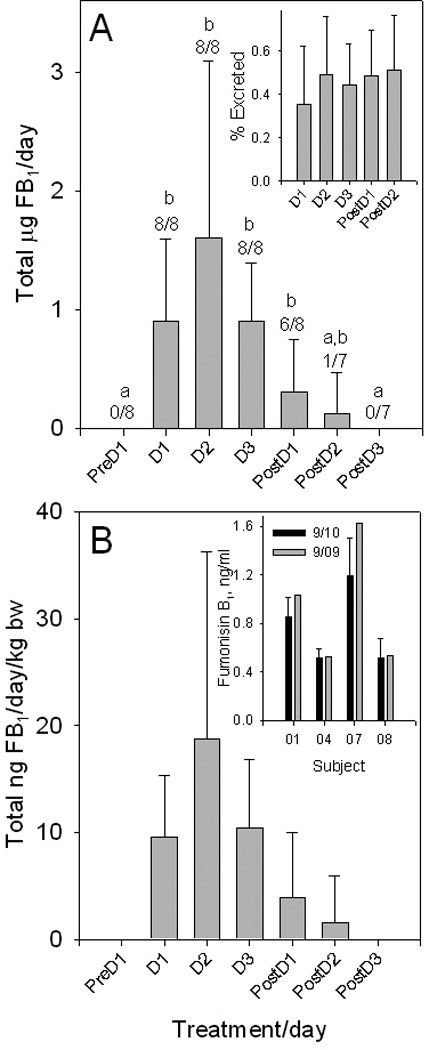
(A) Mean urinary FB1 excreted per day (µg/24 h) by eight volunteers abstaining from consuming maize-foods for 3 days (PreD1), 3 days consuming 6 tortillas and 5 biscuits/days (D1–D3) followed by 3 days abstaining (PostD1-PostD3) (The PostD4 and PostD5 urine samples were not analyzed and samples for PostD2 and 3 were not available for one volunteer). The number of volunteers that were FB1 positive over the total urine samples analyzed is shown above each error bar. Mean values with differing superscripts are significantly different. Inset in (A) is the mean cumulative FB1 excreted in the urine as a percentage of the cumulative FB1 intake. (B) FB1 concentration (ng/ml) normalized to body weight (The results of the statistical analysis was the same as in (A)). Inset in (B) is the results of the re-analysis ((September 2010=9/10, n=3 replicates) of urine samples from four volunteers stored frozen and analyzed 1 year after the initial analysis (September 2009=9/09, n=1).