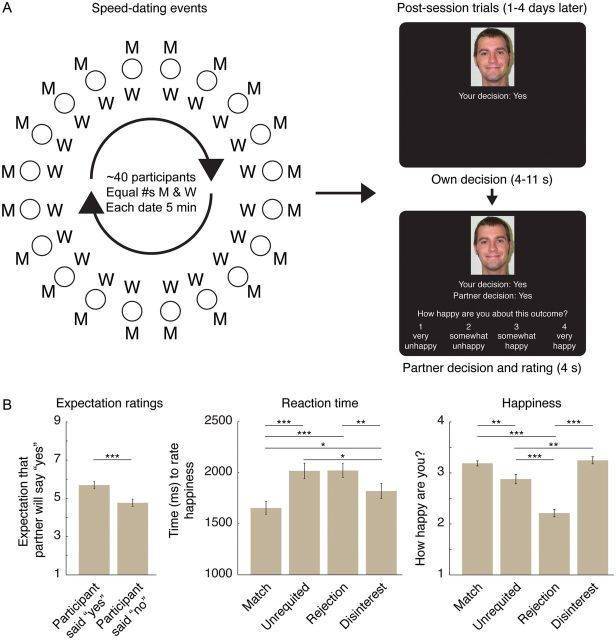
Figure 1.
Experimental design and behavioral results. (A) Experimental design. Participants attended speed-dating events (∼20 of each gender at each) where participants met other participants for 5 min. conversations and made yes or no decisions about whether they wanted to see each partner again. Diagram shows event layout (each “date” at separate table, with 1 gender rotating after each date). Following the events (1–3 days), a subset of participants (N = 38) were scanned with fMRI while they learned about each partner's decision about them. On each trial, participants first saw a partner's face and their own decision about that partner as a reminder; following a randomized delay (4–11 s), participants were then shown the partner's decision, and rated how happy or unhappy they were about the decision (4 s). Following the postsessions, Match partners (mutual yes decisions) then received each other's contact information. Sample photo courtesy of Center for Vital Longevity Face Database. (B) Behavioral results. Left panel: Ratings during the speed-date events, following each date, of how likely that partner was to say yes to the participant (on 9-point Likert-type scale), split by whether the participant had said yes to that partner. Center panel: Reaction times to make a happiness rating during the postscan for each speed-date outcome (see Materials and Methods section for outcome details). Significant differences for reaction times are calculated on square-root-transformed reaction times to account for skew in distribution. Right panel: Happiness ratings during the postscan for each speed-date outcome. All error bars are standard error of the mean within-condition over scanned participants. ***P < 0.001; **P < 0.01; *P < 0.05.

