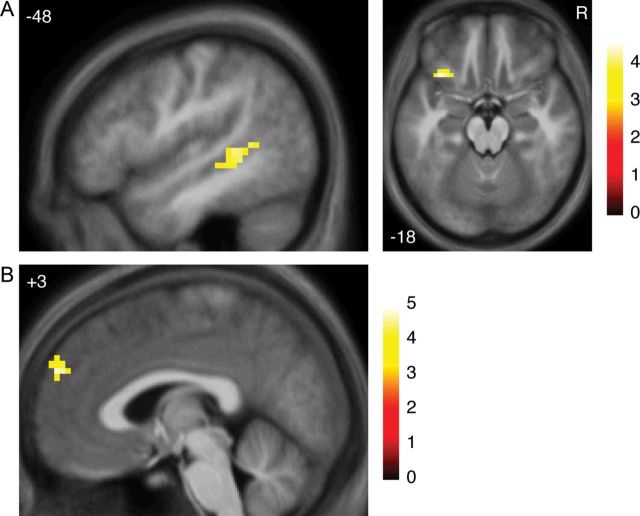
Figure 2.
Activations involved in violations of expectations. (A) Regions activated more for receiving a mismatched decision (Rejection + Unrequited outcomes) compared with a matched decision (Match + Disinterest outcomes). R indicates right. (B) Region correlated with unsigned prediction errors about partner decisions, based on RL model of participant's own desirability. All images thresholded at P < 0.001 voxelwise with extent threshold set to control whole-brain FWE at P < 0.05 (27–33 voxels). Color bars indicate t-statistic. Coordinates in ICBM/MNI space.

