
Figure 1.
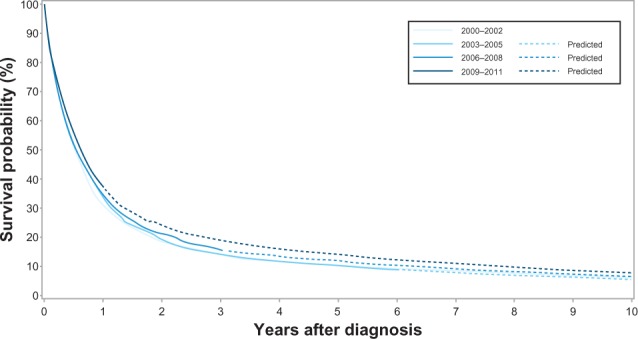
Kaplan–Meier curves for lung cancer patients in the Central Denmark Region for four study periods.
Official websites use .gov
A
.gov website belongs to an official
government organization in the United States.
Secure .gov websites use HTTPS
A lock (
) or https:// means you've safely
connected to the .gov website. Share sensitive
information only on official, secure websites.
Kaplan–Meier curves for lung cancer patients in the Central Denmark Region for four study periods.