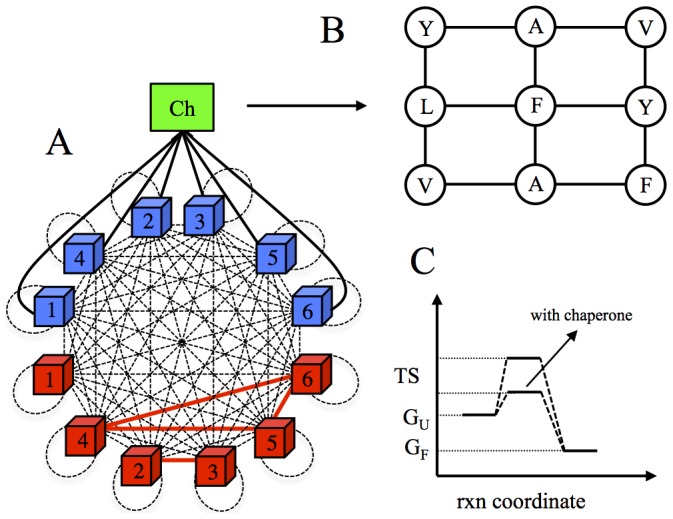
Figure 1. Pictorial depictions of molecular interactions, chaperone interaction surface, and free energy-reaction coordinates diagram.

(A) A schematic representation of molecular interactions in the model cell. The folded (red cubes) and MG state (blue cubes) proteins in the cytosol of model cell are allowed to interact with each other to form functional (red solid lines) and non-functional (black dashed lines) interactions, which include homodimeric self-interactions (black dashed loops). Black solid lines represent the PPI network of chaperone (green square). (B) Chaperone interaction surface. A single face of cube, consisting of nine amino acid residues is used to model the interaction between chaperone and unfolded proteins. (C) Reaction (rxn) coordinate vs. free energy diagram for protein folding with and without chaperones, highlighting the catalytic activity of chaperones.
