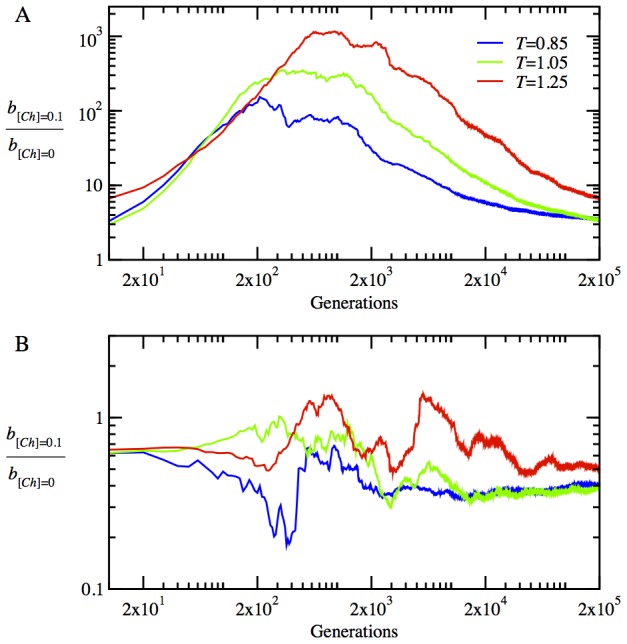
Figure 2. The time evolution of the fitness ratios  (i.e. the ratio of birth rates with chaperones and without chaperones) are presented for the active
  in (A) and passive
  model in (B) for three different temperatures.

The fitness ratios and evolutionary time are in log scale to convey the events clearly across all time scales. All data here and in the subsequent figures are ensemble averages over 100 independent stochastic trajectories.
