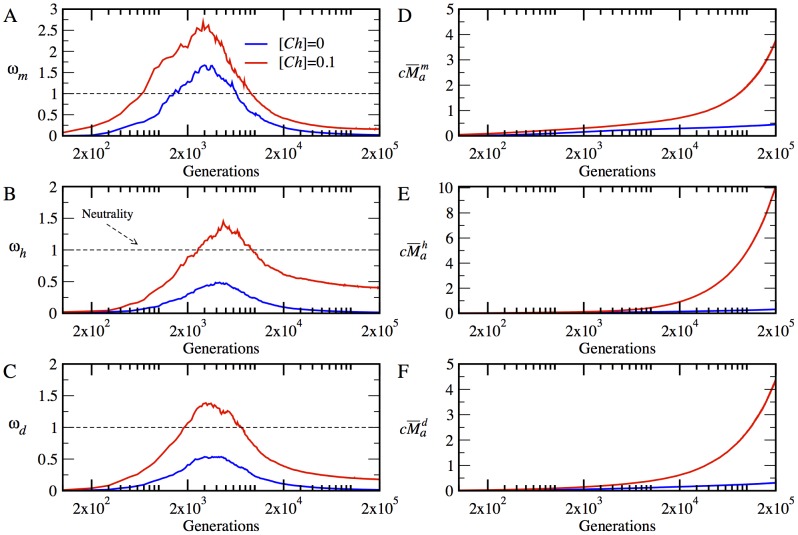
Figure 5. The time evolution of mean  and
and  in the absence and presence of chaperones, i.e. for
  (blue lines) and
  (red lines), respectively.
The dashed line at  represents the neutral evolution. The time evolution of
  is plotted in (A) for the monomer
  , in (B) for the heterodimer
  , and in (C), for the date triangle
  . The time evolution of
  is plotted in (D) for the monomer
  , in (E) for the heterodimer
  , and in (F) for the date triangle
  .
.

