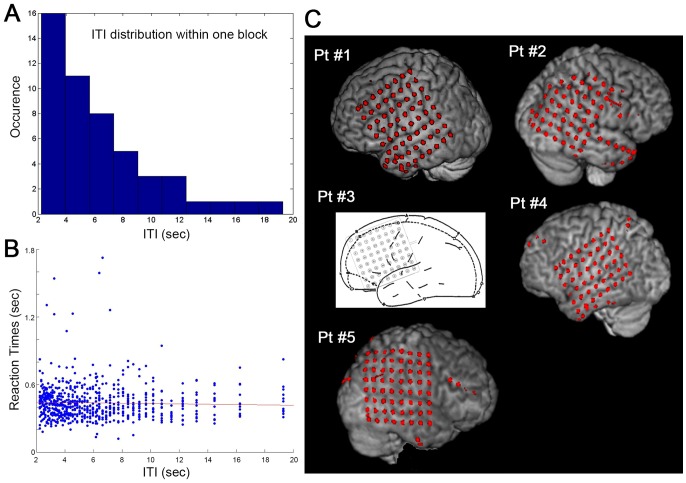
Figure 1. Task design, behavioral data and electrode coverage.
(A) The distribution of inter-trial intervals (ITIs) in one task block containing 50 trials. This distribution is identical across blocks. (B) A scatter plot of reaction times (RT) against ITI across all hit trials in all subjects over contralateral blocks. There was no dependence of RT on ITI (P>0.1, Spearman rank correlation). The red line indicates the best linear regression fit. (C) Electrode locations in each subject overlaid on the pial surface reconstructed from the subject's own anatomical MRI. All intracranial electrodes are shown, including electrodes excluded due to signal quality issues or from the Laplacian montage derivation (those on the electrode strips or on the edge of the grid). For Pt #3, the clinical CT scan was not acquired, thus electrode locations could not be determined in relation to the MRI and the presurgical planning diagram is shown instead.

