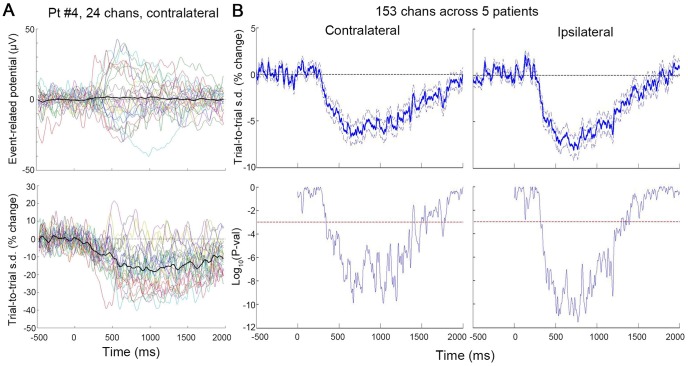
Figure 2. Reduction of trial-to-trial variability following stimulus onset.
(A) Averaged ERPs (top) and trial-to-trial variability time courses (bottom) for all 24 Laplacian electrodes from Pt #4 (contralateral data). The variability time course was computed as standard deviation (s.d.) across trials, normalized to the mean of the pre-stimulus period (−500∼0 ms) and expressed in %change unit. Thick black traces denote the average across 24 electrodes. (B) Top: Trial-to-trial variability time course averaged across all 153 Laplacian electrodes in five subjects. Dashed lines depict mean±SEM. Bottom: Significance of the variability time course, assessed by a one-sample t-test across 153 electrodes against the null hypothesis of no change from baseline. The left column is obtained using contralateral data, and the right column using ipsilateral data. Red dashed lines indicate significance level of P = 0.001.

