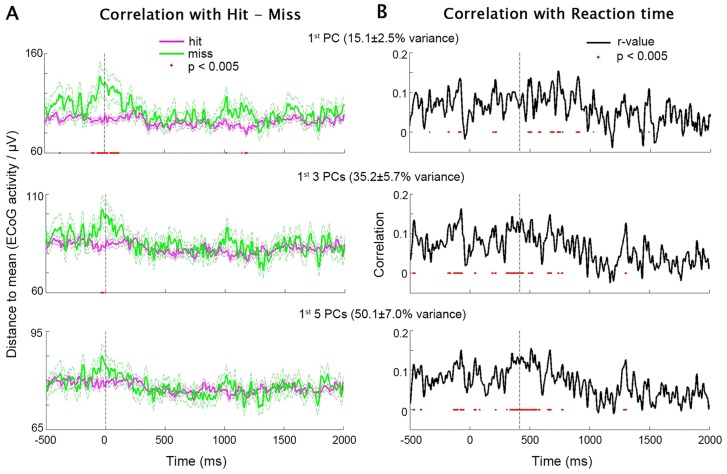
Figure 4. PCA test of the Inverted-U hypothesis using contralateral data.
(A) D(t) combined across the first one (top), three (middle) and five (bottom) PCs in each subject, averaged for hit and miss trials separately (data from all subjects were included). Flanking dashed lines depict mean±SEM. Red dots: P<0.005 for hit vs. miss trials, two-sample t-test. Vertical dashed line indicates stimulus onset. (B) Time courses of Pearson correlation coefficient between D(t) and RT across all hit trials (including data from all subjects). D(t) was combined across the first one (top), three (middle) and five (bottom) PCs in each subject. Red dots: P<0.005 for significant D(t)-RT correlation. Vertical dashed line indicates the time of median RT across all subjects.

