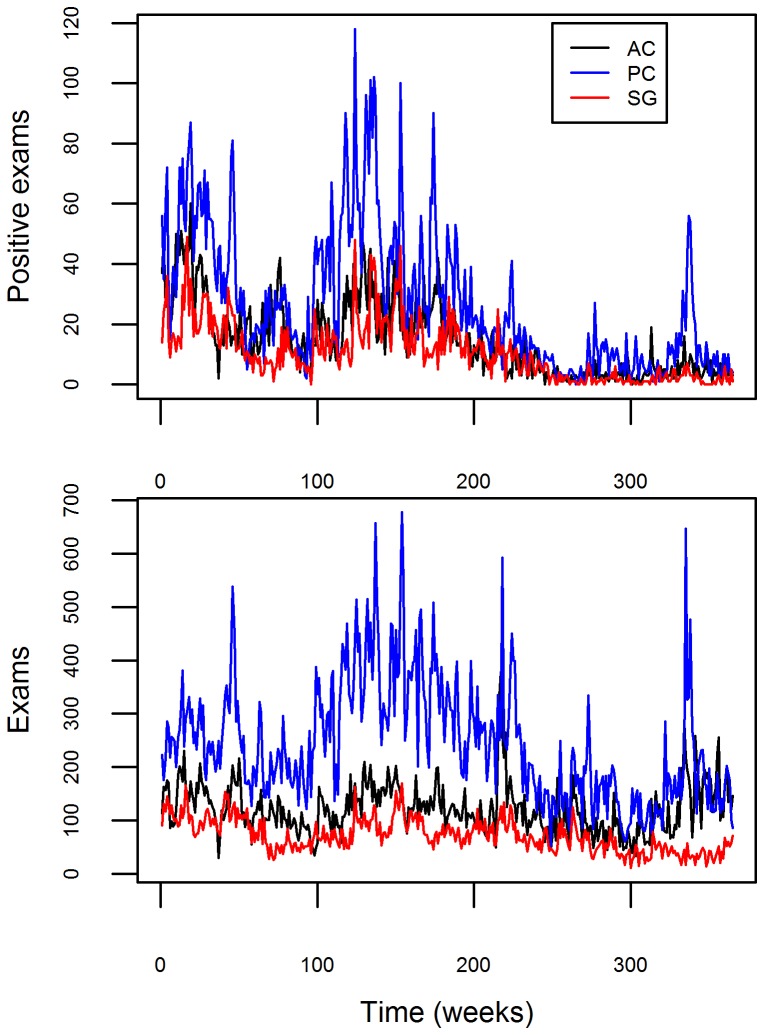
Figure 1. Temporal and geographical distribution of the government surveillance malaria data.
Malaria data depiction for Acrelandia (AC), Placido de Castro (PC), and Senador Guiomard (SG) counties (black, blue, and red lines, respectively). Number of positive exams and total number of exams are shown in upper and lower panels, respectively.

