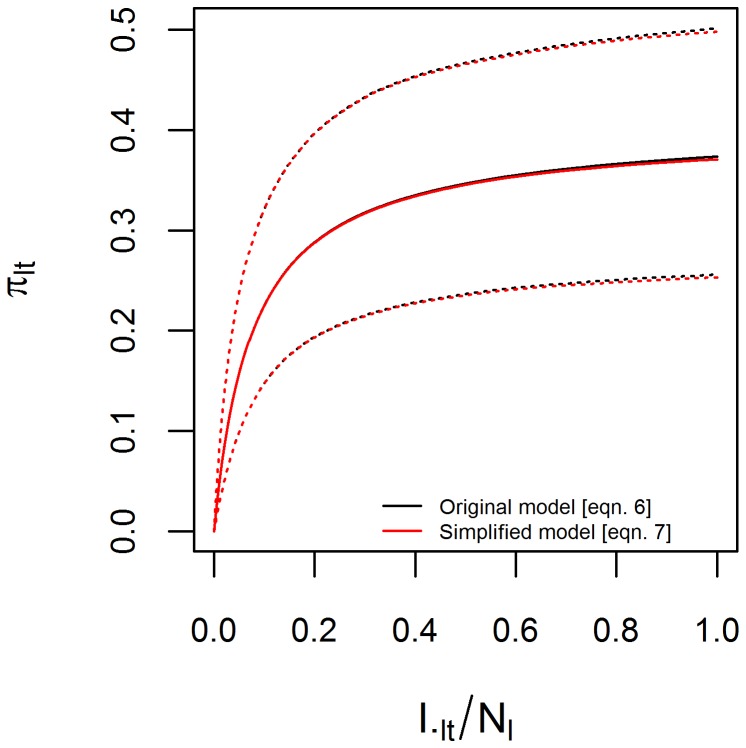
Figure 2. Prior relationship between detection probability given sampled and infection prevalence.
Approximate relationship between detection probability given that the person was sampled by the government surveillance system  and infection prevalence
  , based on informative priors on the parameters of the observation model (Table 2). Solid and dashed lines are the median and 95% prior credible intervals based on the original (eqn. 6, black lines) and simplified (eqn. 7, red lines) observation models.

