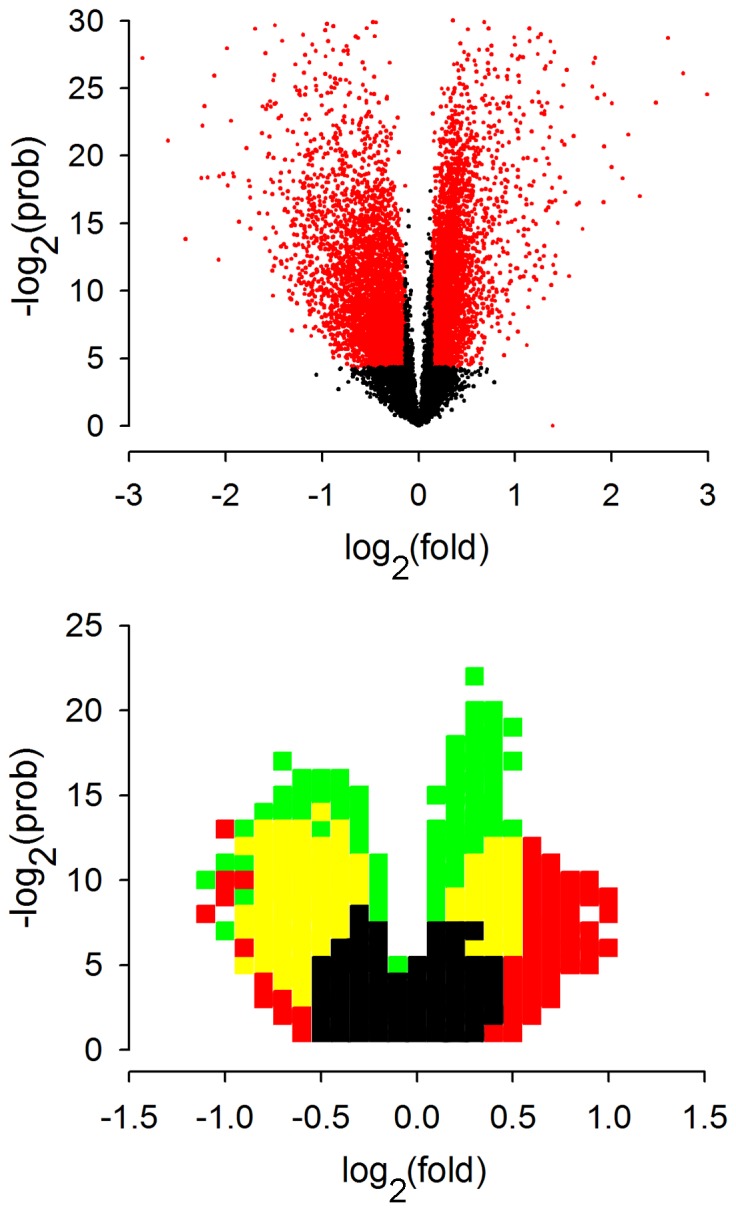
Figure 2. Volcano plots of the transcriptional responses to GDF11.

Volcano plots are scatter plots of the log2 fold change against the negative log2 probability calculated by Student’s t-test. The points in red correspond to those probe sets passing the p<0.05 significance and 10% fold change thresholds. GDF11 treatment clearly elicits a substantial response that is skewed towards a downregulation of transcript levels (top). The relative transcriptional response to GDF11 can be compared to the other canonical pathways by superimposing the volcano plots (bottom). Here, pixels (δlog2(prob) = 1, δlog2(fold) = 0.1) are coloured if they contain more than 10 points. The ‘density plot’ illustrates the similar magnitude of GDF11 treatment (green/yellow) and EGF receptor inhibition (red,yellow), which both dominate the FGF receptor inhibition response (black).
