Fig. 4.

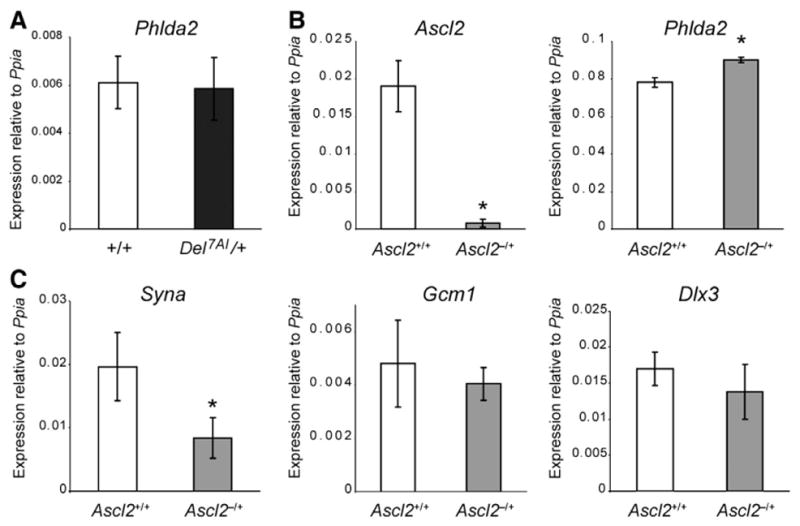
Dysregulation of Phlda2 in Ascl2-null placentae. (A) Phlda2 qRT-PCR on E13.5 embryo was carried out on three technical replicates each from three individual Del7AI/+ embryos and three wild type littermate individual embryos (biological replicates) and the error bars shown are the standard deviation for biological replicates. Expression is relative to Ppia. No significant difference was found between the two genotypes (p = 0.8). Gene expression analysis by qRT-PCR on total E9.5 placental RNA from Ascl2lacZ/+ (Ascl2−/+) mutants and wild type littermates (Ascl2+/+). Analysis is presented for (B) Ascl2 and Phlda2, as well as the labyrinth trophoblast markers Syna, Gcm1, and Dlx3 (C). The results show a significant increase in Phlda2 expression in Ascl2-deficient placentae but not for the syncytiotrophoblast markers Gcm-1 and Dlx3. Syna was also downregulated in mutant placentae. Expression levels are relative to Ppia levels. Asterisks mark mutant levels statistically different from wild type levels (for Ascl2 p = 0.0008; for Phlda2 p = 0.002, and p = 0.012 for Syna).
