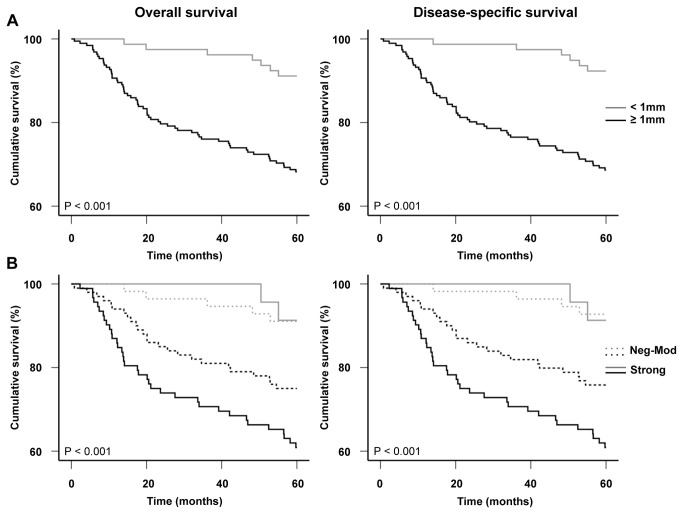
Figure 4. Kaplan-Meier analyses for the correlations between primary tumor thickness, Cten expression, and patient survival.
(A) Tumors ≥1mm thick (n=192) were significantly associated with a poorer overall and disease-specific survival for primary melanoma patients compared to tumors <1mm thick (n=79, P < 0.001 for both, log-rank tests). (B) Strong Cten staining was significantly associated with a poorer overall and disease-specific 5-year survival for patients with tumors ≥1mm thick (black lines, P = 0.031 and 0.022, respectively) but not with tumors <1mm thick (gray lines, P = 0.939 and 0.857, respectively). A significant difference was also observed between tumors <1mm thick with neg-mod Cten expression and tumors ≥1mm thick with neg-mod (P = 0.014 and 0.009, respectively) or strong Cten expression (P = 0.001 and <0.001, respectively), and between tumors <1mm thick with strong Cten expression and tumors ≥1mm thick with strong Cten expression (P = 0.007 for both), but not between tumors <1mm thick with strong Cten expression and tumors ≥1mm with neg-mod Cten expression (P = 0.085 and 0.098, respectively, P < 0.001 overall, log-rank tests).

