
Figure 2. Aβ 42 monomers in a POPC bilayer.
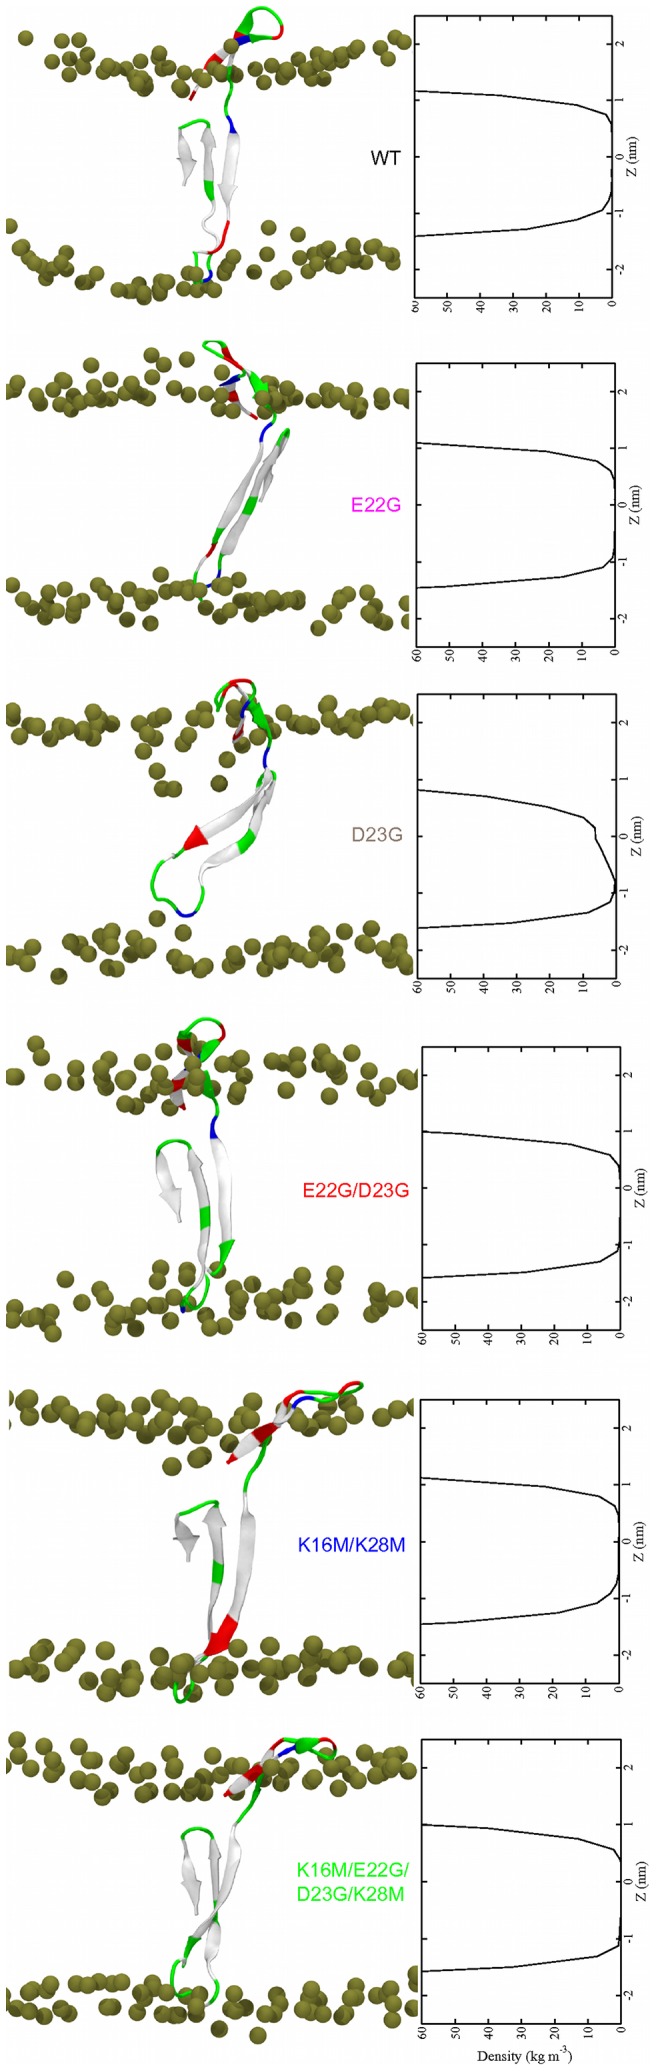
(Left) Final structures at t = 500 ns. The coloring explanation for the peptides and lipids is given in Fig. 1. (Right) Time averaged water density within the bilayer.
Official websites use .gov
A
.gov website belongs to an official
government organization in the United States.
Secure .gov websites use HTTPS
A lock (
) or https:// means you've safely
connected to the .gov website. Share sensitive
information only on official, secure websites.
(Left) Final structures at t = 500 ns. The coloring explanation for the peptides and lipids is given in Fig. 1. (Right) Time averaged water density within the bilayer.