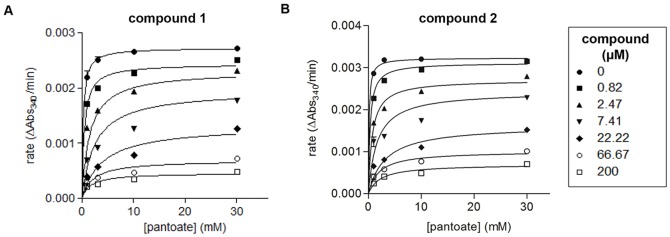
Figure 4. Biochemical characterization of Class 1 compounds.

Michaelis-Menten plots with varied concentrations of pantoate and A) compound 1 and B) compound 2. Graphpad Prism was used to fit the data to nonlinear regressions.

Michaelis-Menten plots with varied concentrations of pantoate and A) compound 1 and B) compound 2. Graphpad Prism was used to fit the data to nonlinear regressions.