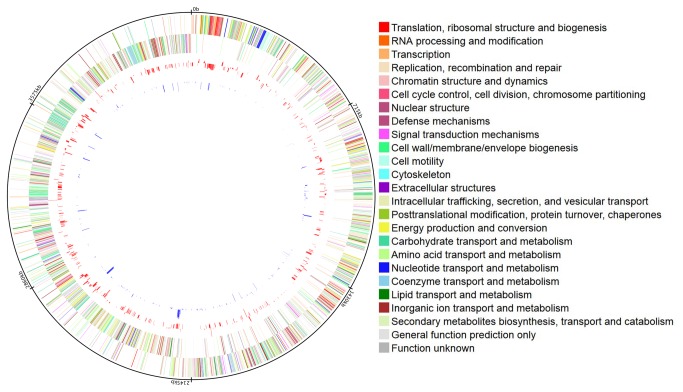
Figure 1. Projection of differentially expressed genes from nutrient shift and osmotic shock on C. difficile 630 genome.
RNA-seq data was converted into FPKM values using cufflinks[44]. When compared to control condition, genes with log ratio ≥ 1.5 and FDR- adjusted p value less than or equal to 0.05 were considered as differentially expressed. Circles are numbered from outside to inside. Circle 1 - Molecular clock indicating genome size. Circle 2 - COG gene categories on the forward strand, Circle 3 - COG gene categories on the forward strand. Details of COG color codes in circles 2 & 3 are shown on the right side of the projection. Circle 4 - log2 fold change values of differentially expressed genes under nutrient shift. Circle 5 - log2 fold change values of differentially expressed genes under osmotic shock.

